
2023-24 PAL Rating and Value Rating: performance and contract value
Two scores from 0 to 100, where 50 is the average NHL player. PAL Rating measures performance: offense, creation, shooting, possession, defense, discipline, power play and penalty kill, compared with players at the same position and adjusted for ice time. A defensive player isn't punished for not scoring: the score starts from the player's strength, offensive or defensive, and every player gets a profile. Salary never enters it. Value Rating answers a different question: for what the player costs, does the return come in more or less than expected?
How it's calculated →WAR, in wins →Best-value contracts →
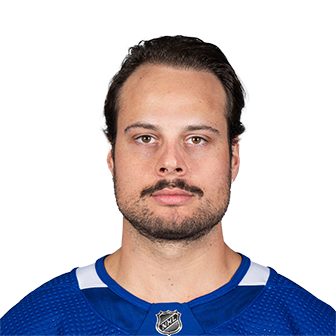 100PAL100ValueAuston Matthews
 TOR · EliteTop defenseman
 100PAL100ValueAdam Fox
 NYR · EliteTop goalie
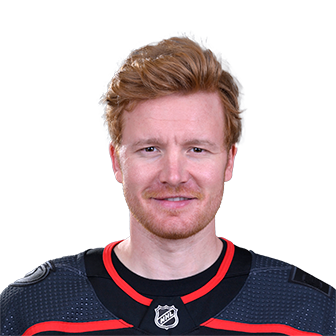 99PAL98ValueFrederik Andersen
 CAR · Elite
Best contracts
Highest Value Rating among players rated 70 or more.
- 100Auston MatthewsTOR · 11.64 M$ · PAL 100 (expected 81)
- 100Sam ReinhartFLA · 6.50 M$ · PAL 100 (expected 75)
- 100Adam FoxNYR · 9.50 M$ · PAL 100 (expected 80)
- 100Quinn HughesVAN · 7.85 M$ · PAL 99 (expected 76)
- 100Evan BouchardEDM · 3.90 M$ · PAL 99 (expected 64)
Heaviest contracts
Lowest Value Rating among cap hits of $5M or more.
- 0Ryan StromeANA · 5.00 M$ · PAL 0 (expected 71)
- 1Josh AndersonMTL · 5.50 M$ · PAL 2 (expected 72)
- 2Cam FowlerANA · 6.50 M$ · PAL 7 (expected 74)
- 2Andrew CoppDET · 5.63 M$ · PAL 9 (expected 72)
- 3Brayden SchennSTL · 6.50 M$ · PAL 12 (expected 75)
The scale — PAL Rating
- 90–100 Elite
- 80–89 Excellent
- 70–79 Very good
- 60–69 Above average
- 40–59 Around average
- 20–39 Below average
- 0–19 Very poor
The scale — Value Rating
- 90–100 Exceptional value
- 75–89 Very good contract
- 55–74 Good value
- 45–54 Fair value
- 25–44 Poor return
- 0–24 Very poor return
| # | Player | Profile | |||||||||||||||
|---|---|---|---|---|---|---|---|---|---|---|---|---|---|---|---|---|---|
| 1 | Auston MatthewsTOR · F | 100 | 100 | Two-way | 100 | 89 | 11.64 M$ | 8.3 | 81 | 98 | 100 | 100 | 98 | 76 | 87 | 98 | 81 |
| 2 | Sam ReinhartFLA · F | 100 | 100 | Two-way | 99 | 100 | 6.50 M$ | 6.0 | 82 | 97 | 98 | 99 | 95 | 100 | 41 | 96 | 97 |
| 3 | Nathan MacKinnonCOL · F | 99 | 97 | Offensive | 99 | 53 | 12.60 M$ | 7.0 | 82 | 100 | 82 | 96 | 99 | 32 | 89 | 100 | 31 |
| 4 | Connor McDavidEDM · F | 99 | 99 | Two-way | 99 | 75 | 12.50 M$ | 4.9 | 76 | 99 | 80 | 84 | 100 | 45 | 98 | 99 | 60 |
| 5 | Zach HymanEDM · F | 99 | 99 | Two-way | 100 | 76 | 5.50 M$ | 4.3 | 80 | 92 | 100 | 100 | 100 | 49 | 25 | 95 | 64 |
| 6 | Aleksander BarkovFLA · F | 99 | 98 | Two-way | 95 | 99 | 10.00 M$ | 2.8 | 73 | 95 | 77 | 62 | 97 | 97 | 65 | 97 | 97 |
| 7 | Artemi PanarinNYR · F | 98 | 94 | Offensive | 98 | 51 | 11.64 M$ | 6.6 | 82 | 99 | 50 | 98 | 95 | 34 | 80 | 98 | 17 |
| 8 | Kirill KaprizovMIN · F | 98 | 97 | Offensive | 99 | 61 | 9.00 M$ | 5.5 | 75 | 98 | 94 | 99 | 92 | 50 | 70 | 100 | 34 |
| 9 | Filip ForsbergNSH · F | 98 | 94 | Offensive | 98 | 44 | 8.50 M$ | 4.5 | 82 | 97 | 97 | 99 | 81 | 35 | 82 | 93 | 36 |
| 10 | William KarlssonVGK · F | 98 | 99 | Two-way | 93 | 98 | 5.90 M$ | 3.8 | 70 | 91 | 89 | 93 | 96 | 96 | 93 | 84 | 94 |
| 11 | Nikita KucherovTBL · F | 97 | 90 | Offensive | 98 | 19 | 9.50 M$ | 4.7 | 81 | 100 | 70 | 89 | 87 | 11 | 82 | 99 | 16 |
| 12 | David PastrnakBOS · F | 97 | 91 | Offensive | 98 | 21 | 11.25 M$ | 4.3 | 82 | 99 | 93 | 97 | 78 | 14 | 85 | 98 | 38 |
| 13 | Seth JarvisCAR · F | 97 | 100 | Two-way | 91 | 95 | 0.89 M$ | 2.6 | 81 | 81 | 85 | 95 | 92 | 92 | 85 | 89 | 94 |
| 14 | Matthew TkachukFLA · F | 97 | 93 | Offensive | 97 | 36 | 9.50 M$ | 2.5 | 80 | 98 | 96 | 69 | 93 | 16 | 95 | 99 | 71 |
| 15 | Jason RobertsonDAL · F | 96 | 92 | Two-way | 90 | 96 | 7.75 M$ | 4.1 | 82 | 87 | 70 | 74 | 95 | 97 | 63 | 91 | 47 |
| 16 | Roope HintzDAL · F | 96 | 91 | Two-way | 92 | 90 | 8.45 M$ | 3.4 | 80 | 83 | 80 | 91 | 94 | 65 | 78 | 95 | 95 |
| 17 | Brady TkachukOTT · F | 96 | 91 | Offensive | 97 | 37 | 8.21 M$ | 2.6 | 81 | 93 | 100 | 87 | 94 | 15 | 86 | 92 | 75 |
| 18 | John TavaresTOR · F | 96 | 87 | Offensive | 95 | 71 | 11.00 M$ | 0.2 | 80 | 80 | 100 | 89 | 77 | 58 | 73 | 92 | 75 |
| 19 | Matt BoldyMIN · F | 95 | 91 | Two-way | 94 | 85 | 7.00 M$ | 2.8 | 75 | 90 | 83 | 92 | 93 | 83 | 36 | 97 | 41 |
| 20 | Jack HughesNJD · F | 95 | 89 | Offensive | 95 | 45 | 8.00 M$ | 2.4 | 62 | 95 | 90 | 86 | 76 | 36 | 98 | 94 | 52 |
| 21 | Conor GarlandVAN · F | 95 | 94 | Two-way | 78 | 97 | 4.95 M$ | 2.3 | 82 | 75 | 75 | 65 | 99 | 98 | 93 | 5 | 36 |
| 22 | Noah CatesPHI · F | 95 | 97 | Defensive | 37 | 100 | 2.63 M$ | 1.1 | 59 | 17 | 31 | 13 | 99 | 100 | 92 | 6 | 93 |
| 23 | Joel Eriksson EkMIN · F | 95 | 93 | Two-way | 94 | 79 | 5.25 M$ | 0.7 | 77 | 70 | 99 | 83 | 88 | 80 | 70 | 96 | 11 |
| 24 | Elias PetterssonVAN · F | 94 | 86 | Two-way | 90 | 72 | 7.35 M$ | 4.5 | 82 | 95 | 41 | 80 | 75 | 70 | 98 | 95 | 53 |
| 25 | Brayden PointTBL · F | 94 | 86 | Offensive | 97 | 21 | 9.50 M$ | 4.0 | 81 | 96 | 97 | 99 | 66 | 14 | 78 | 95 | 67 |
| 26 | Mitch MarnerTOR · F | 94 | 85 | Two-way | 94 | 81 | 10.90 M$ | 3.5 | 69 | 96 | 46 | 80 | 80 | 70 | 64 | 97 | 82 |
| 27 | Wyatt JohnstonDAL · F | 94 | 99 | Two-way | 93 | 82 | 0.89 M$ | 2.6 | 82 | 91 | 96 | 94 | 89 | 74 | 45 | 79 | 72 |
| 28 | William NylanderTOR · F | 93 | 84 | Offensive | 96 | 20 | 6.96 M$ | 3.9 | 82 | 97 | 88 | 95 | 64 | 10 | 73 | 98 | 78 |
| 29 | Sebastian AhoCAR · F | 93 | 84 | Two-way | 94 | 77 | 8.46 M$ | 3.4 | 78 | 96 | 73 | 91 | 83 | 30 | 30 | 90 | 99 |
| 30 | Jesper BrattNJD · F | 93 | 81 | Offensive | 93 | 48 | 7.88 M$ | 2.6 | 82 | 94 | 91 | 71 | 92 | 26 | 88 | 89 | 72 |
| 31 | Jake GuentzelCAR · F | 93 | 88 | Offensive | 96 | 24 | 6.00 M$ | 0.6 | 67 | 96 | 99 | 88 | 81 | 13 | 91 | 81 | 67 |
| 32 | J.T. MillerVAN · F | 92 | 81 | Offensive | 97 | 34 | 8.00 M$ | 3.5 | 81 | 99 | 81 | 95 | 49 | 41 | 13 | 97 | 5 |
| 33 | Jack EichelVGK · F | 92 | 77 | Two-way | 88 | 73 | 10.00 M$ | 2.7 | 63 | 92 | 86 | 83 | 78 | 77 | 96 | 66 | 8 |
| 34 | Nico HischierNJD · F | 92 | 81 | Offensive | 92 | 44 | 7.25 M$ | 2.2 | 71 | 88 | 96 | 90 | 75 | 28 | 94 | 85 | 72 |
| 35 | Chris KreiderNYR · F | 92 | 83 | Offensive | 95 | 47 | 6.50 M$ | 2.1 | 82 | 92 | 98 | 96 | 67 | 33 | 30 | 89 | 79 |
| 36 | Dylan LarkinDET · F | 91 | 78 | Offensive | 92 | 39 | 8.70 M$ | 3.3 | 68 | 94 | 83 | 93 | 73 | 36 | 96 | 90 | 8 |
| 37 | Brandon HagelTBL · F | 91 | 95 | Two-way | 87 | 88 | 1.50 M$ | 2.2 | 82 | 93 | 75 | 63 | 92 | 78 | 53 | 70 | 84 |
| 38 | Pius SuterVAN · F | 91 | 95 | Defensive | 59 | 98 | 1.60 M$ | 1.6 | 67 | 45 | 64 | 67 | 85 | 98 | 81 | 48 | 90 |
| 39 | Artturi LehkonenCOL · F | 91 | 86 | Two-way | 87 | 93 | 4.50 M$ | 0.9 | 45 | 73 | 89 | 87 | 90 | 82 | 19 | 82 | 96 |
| 40 | Leon DraisaitlEDM · F | 90 | 73 | Offensive | 96 | 19 | 8.50 M$ | 4.3 | 81 | 98 | 53 | 97 | 84 | 9 | 14 | 100 | 54 |
| 41 | Sidney CrosbyPIT · F | 90 | 74 | Offensive | 96 | 18 | 8.70 M$ | 3.3 | 82 | 97 | 91 | 88 | 75 | 12 | 76 | 92 | 44 |
| 42 | Trevor MooreLAK · F | 90 | 84 | Two-way | 83 | 90 | 4.20 M$ | 2.2 | 82 | 71 | 93 | 73 | 95 | 86 | 69 | 42 | 66 |
| 43 | Garnet HathawayPHI · F | 90 | 91 | Defensive | 30 | 99 | 2.38 M$ | 1.0 | 82 | 10 | 28 | 13 | 95 | 99 | 91 | 20 | 93 |
| 44 | Anthony ManthaVGK · F | 89 | 79 | Two-way | 75 | 94 | 5.70 M$ | 3.2 | 74 | 74 | 42 | 92 | 93 | 96 | 37 | 21 | 50 |
| 45 | Anthony CirelliTBL · F | 89 | 76 | Defensive | 57 | 95 | 6.25 M$ | 2.2 | 79 | 50 | 38 | 60 | 79 | 91 | 92 | 69 | 95 |
| 46 | Quinton ByfieldLAK · F | 89 | 96 | Two-way | 82 | 91 | 0.89 M$ | 1.2 | 80 | 76 | 83 | 62 | 86 | 92 | 46 | 82 | 70 |
| 47 | Stefan NoesenCAR · F | 89 | 97 | Two-way | 84 | 91 | 0.76 M$ | 1.0 | 81 | 68 | 86 | 56 | 98 | 85 | 26 | 81 | 74 |
| 48 | Gabriel VilardiWPG · F | 88 | 84 | Offensive | 90 | 35 | 3.44 M$ | 2.0 | 47 | 89 | 91 | 98 | 33 | 40 | 97 | 84 | 38 |
| 49 | Valeri NichushkinCOL · F | 88 | 76 | Offensive | 92 | 48 | 6.13 M$ | 1.7 | 54 | 87 | 92 | 95 | 65 | 32 | 48 | 92 | 84 |
| 50 | Eetu LuostarinenFLA · F | 88 | 92 | Defensive | 35 | 99 | 1.50 M$ | 1.5 | 82 | 18 | 43 | 18 | 88 | 94 | 83 | 23 | 98 |
PickALeague calculation from the play-by-play and on-ice shifts of every game (NHL data) and the season's cap hits.