



Stats 2016-17
San Jose Sharks
10-12-222 PTS4th in the Pacific divisionNHL
Playoff odds
6%
Power play
19.8 %
Penalty kill
74.4 %
Goals per game
2.58
Goals against
3.50
Faceoffs
46.5 %
Team leaders
Points
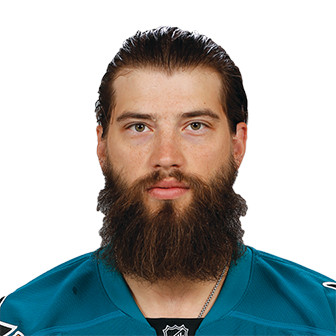 Brent Burns76
Goals
Brent Burns29Assists
Brent Burns47+/-
Brent Burns+19Power-play points
Brent Burns25Hits
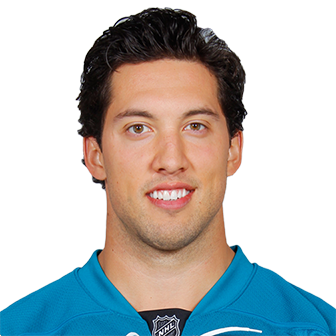 Brenden Dillon174
Wins
 Martin Jones35
Save %
 Aaron Dell.931
- 2. Martin Jones.912
Players (30)
| Player | |||||
|---|---|---|---|---|---|
| Brent BurnsD | 82 | 29 | 47 | 76 | +19 |
| Joe PavelskiC | 81 | 29 | 39 | 68 | +11 |
| Logan CoutureC | 73 | 25 | 27 | 52 | +11 |
| Joe ThorntonC | 79 | 7 | 43 | 50 | +7 |
| Patrick MarleauC | 82 | 27 | 19 | 46 | +4 |
| Joel WardR | 78 | 10 | 19 | 29 | -2 |
| Marc-Edouard VlasicD | 75 | 6 | 22 | 28 | +4 |
| Paul MartinD | 81 | 4 | 22 | 26 | +10 |
| Mikkel BoedkerL | 81 | 10 | 16 | 26 | 0 |
| Chris TierneyC | 80 | 11 | 12 | 23 | 0 |
| Tomas HertlC | 49 | 10 | 12 | 22 | -8 |
| Melker KarlssonC | 67 | 11 | 11 | 22 | +7 |
| Kevin LabancR | 55 | 8 | 12 | 20 | +9 |
| David SchlemkoD | 62 | 2 | 16 | 18 | +4 |
| Joonas DonskoiR | 61 | 6 | 11 | 17 | -5 |
| Justin BraunD | 81 | 4 | 9 | 13 | +1 |
| Micheal HaleyL | 58 | 2 | 10 | 12 | +6 |
| Brenden DillonD | 81 | 2 | 8 | 10 | -2 |
| Tommy WingelsC | 37 | 5 | 3 | 8 | -2 |
| Dylan DeMeloD | 25 | 1 | 7 | 8 | +2 |
| Jannik HansenR | 15 | 2 | 5 | 7 | 0 |
| Timo MeierR | 34 | 3 | 3 | 6 | +1 |
| Marcus SorensenL | 19 | 1 | 3 | 4 | -1 |
| Ryan CarpenterC | 11 | 2 | 2 | 4 | +5 |
| Matt NietoL | 16 | 0 | 2 | 2 | -3 |
| Mirco MuellerD | 4 | 1 | 1 | 2 | +2 |
| Barclay GoodrowC | 3 | 0 | 1 | 1 | 0 |
| Danny O'ReganC | 3 | 1 | 0 | 1 | -2 |
| Tim HeedD | 1 | 0 | 0 | 0 | 0 |
| Nikolay GoldobinR | 2 | 0 | 0 | 0 | -1 |
Stats and photos: NHL (NHL.com)