
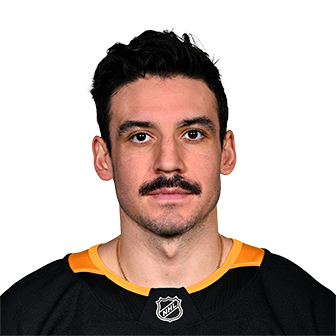
Matt
Nieto
L · Defensive · Below average
- PAL
- 20
- WAR
- -0.1
- PTS
- 3
2024-25№ 459 / 596
Matt Nieto stats, profile and latest news: offensive production, ice time, advanced stats and headlines.
Matt Nieto
Retired 2025#83L
HEIGHT : 180 cm · WEIGHT : 86 kg · SHOOTS : L
Born : November 4, 1992 · Long Beach, United States
Drafted : 2011 · SJS · round 2, pick #47
NHL record
| Year | Team | GP | G | A | PTS | PIM |
|---|---|---|---|---|---|---|
| 2024-25 | Pittsburgh Penguins | 32 | 1 | 2 | 3 | 4 |
| 2023-24 | Pittsburgh Penguins | 22 | 1 | 3 | 4 | 4 |
| 2022-23 | Colorado Avalanche | 36 | 4 | 5 | 9 | 8 |
| 2022-23 | San Jose Sharks | 45 | 8 | 7 | 15 | 8 |
| 2021-22 | San Jose Sharks | 70 | 6 | 11 | 17 | 19 |
| 2020-21 | San Jose Sharks | 28 | 5 | 2 | 7 | 4 |
| 2019-20 | Colorado Avalanche | 70 | 8 | 13 | 21 | 6 |
| 2018-19 | Colorado Avalanche | 64 | 4 | 19 | 23 | 8 |
| 2017-18 | Colorado Avalanche | 74 | 15 | 11 | 26 | 14 |
| 2016-17 | Colorado Avalanche | 43 | 7 | 4 | 11 | 4 |
| 2016-17 | San Jose Sharks | 16 | 0 | 2 | 2 | 4 |
| 2015-16 | San Jose Sharks | 67 | 8 | 9 | 17 | 10 |
| 2014-15 | San Jose Sharks | 72 | 10 | 17 | 27 | 20 |
| 2013-14 | San Jose Sharks | 66 | 10 | 14 | 24 | 16 |
| NHL totals | 705 | 87 | 119 | 206 | 129 | |
Playoffs
| Year | Team | GP | G | A | PTS | PIM |
|---|---|---|---|---|---|---|
| 2022-23 | Colorado Avalanche | 7 | 0 | 0 | 0 | 2 |
| 2019-20 | Colorado Avalanche | 14 | 1 | 2 | 3 | 4 |
| 2018-19 | Colorado Avalanche | 12 | 4 | 3 | 7 | 2 |
| 2017-18 | Colorado Avalanche | 6 | 0 | 3 | 3 | 2 |
| 2015-16 | San Jose Sharks | 16 | 1 | 2 | 3 | 8 |
| 2013-14 | San Jose Sharks | 7 | 2 | 3 | 5 | 0 |
| Playoff totals | 62 | 8 | 13 | 21 | 18 | |
Matt Nieto: our analysis
2024-25 season: 32 GP, 1 G, 2 A, 3 PTS, -8 +/-, 12:15 TOI. WAR -0.1 (459th of 596) · PAL 20, below average.
In 2024-25, Matt Nieto, 33, posts a PAL Rating of 20 out of 100 (below average), and his WAR of -0.1 ranks 459th among 596 regulars, in the bottom quarter.
His strengths: penalty kill (79, well above average) and defense (72, above average). On the other hand, offense (3, among the weakest in the league) and shooting (4, among the weakest in the league) hold him back.
Breaking down his WAR (goals above average), his biggest contribution: EV defense (+0.5); his biggest cost: finishing (-1.3).
An improvement on 2023-24, when his PAL was 14; his WAR, though, went from -0.1 to -0.1.
Matt Nieto's story
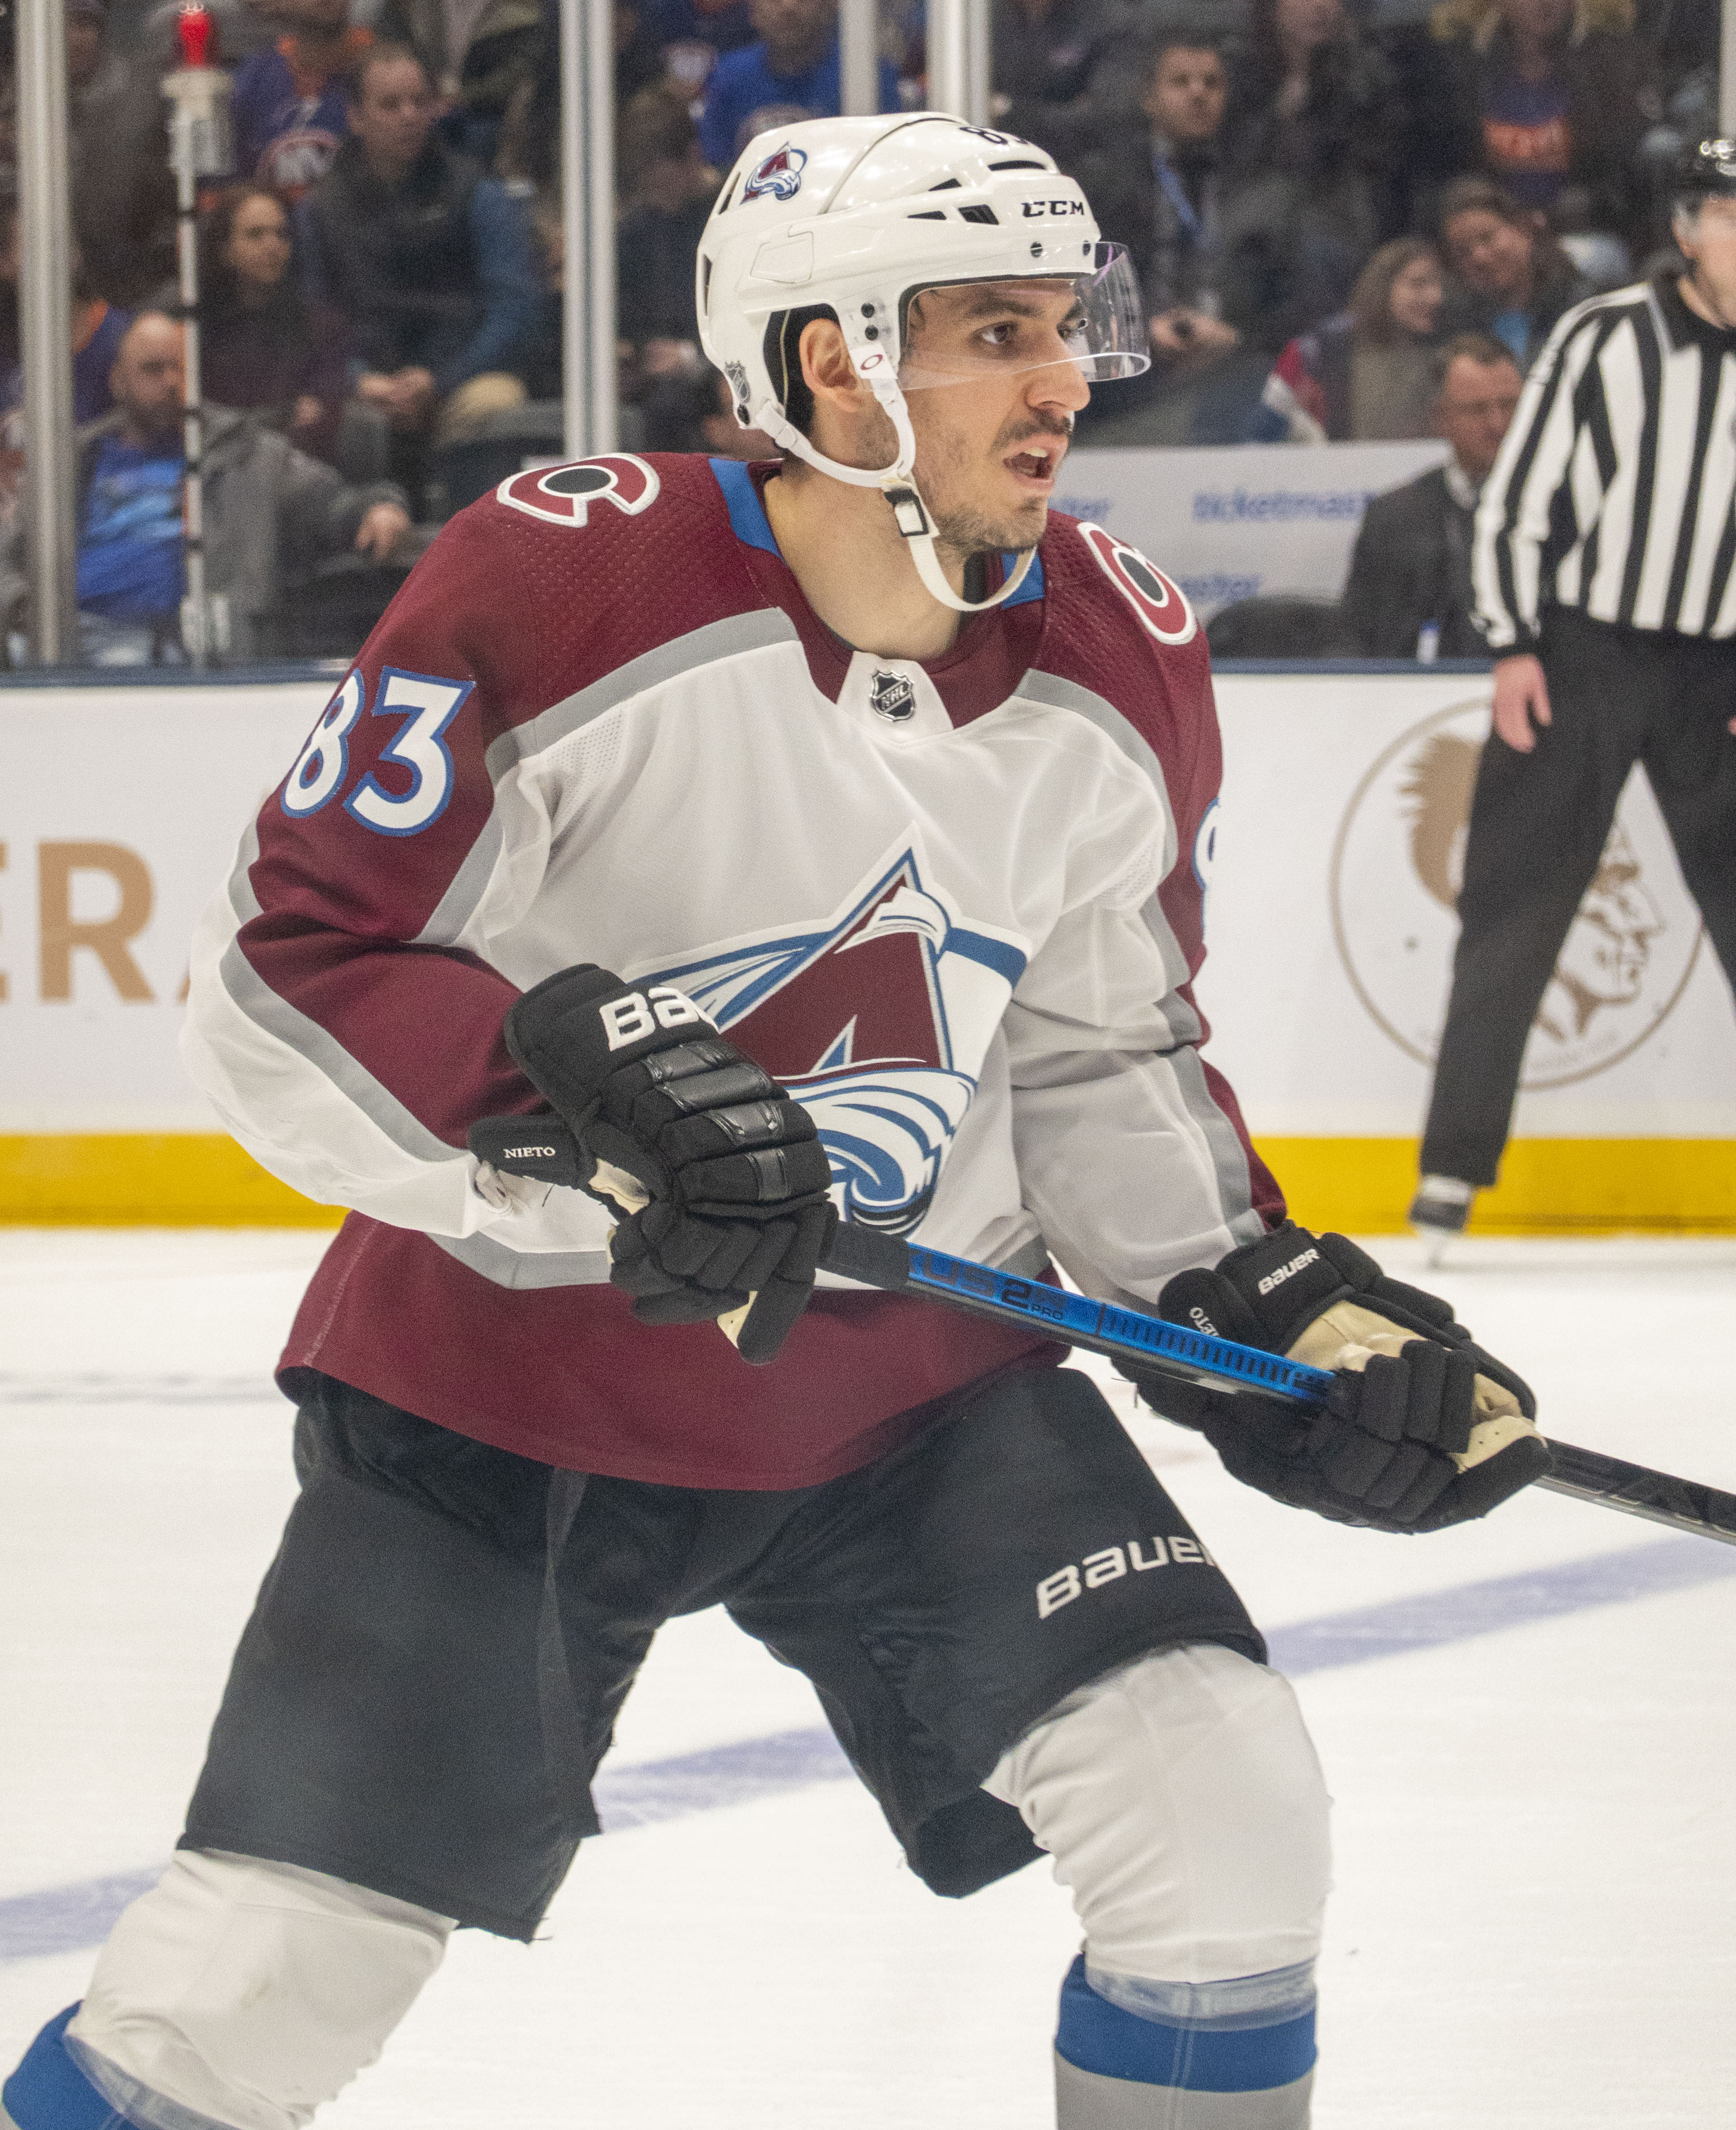
Growing up in Long Beach, Matt Nieto moved from rollerblades in the driveway to organized ice tournaments early, appearing at the Quebec pee-wee event with the Los Angeles Hockey Club alongside future NHL peers.
A prep season at Salisbury School led Nieto to the USA Hockey National Team Development Program in Ann Arbor, where he produced steadily for U17, U18 and the USHL squad. He then chose the college route, accepting a full scholarship to Boston University; over three seasons with the Terriers he totaled 44 goals and 102 points in 115 games, performances that helped his standing ahead of the 2011 NHL Entry Draft.
The San Jose Sharks selected Nieto 47th overall in 2011. He turned professional in 2013, split time between the Sharks and their AHL affiliate in Worcester, and made his NHL debut on October 3, 2013, scoring his first NHL goal days later. He also registered his first Stanley Cup playoff goal in April 2014.
Nieto’s role shifted in January 2017 when the Colorado Avalanche claimed him off waivers; he set career highs in 2017–18 with 74 games and 15 goals and later signed a two-year extension. He returned to San Jose as a free agent in 2020, reached the 500-game NHL milestone in March 2021, was traded back to Colorado in January 2023, and signed with the Pittsburgh organization in July 2023.
Internationally, Nieto represented the United States at the IIHF World U18 Championships in 2009 and 2010, helping Team USA win consecutive gold medals. His strengths are quickness through the neutral zone, puck-handling on the move and adaptability to different forward roles.
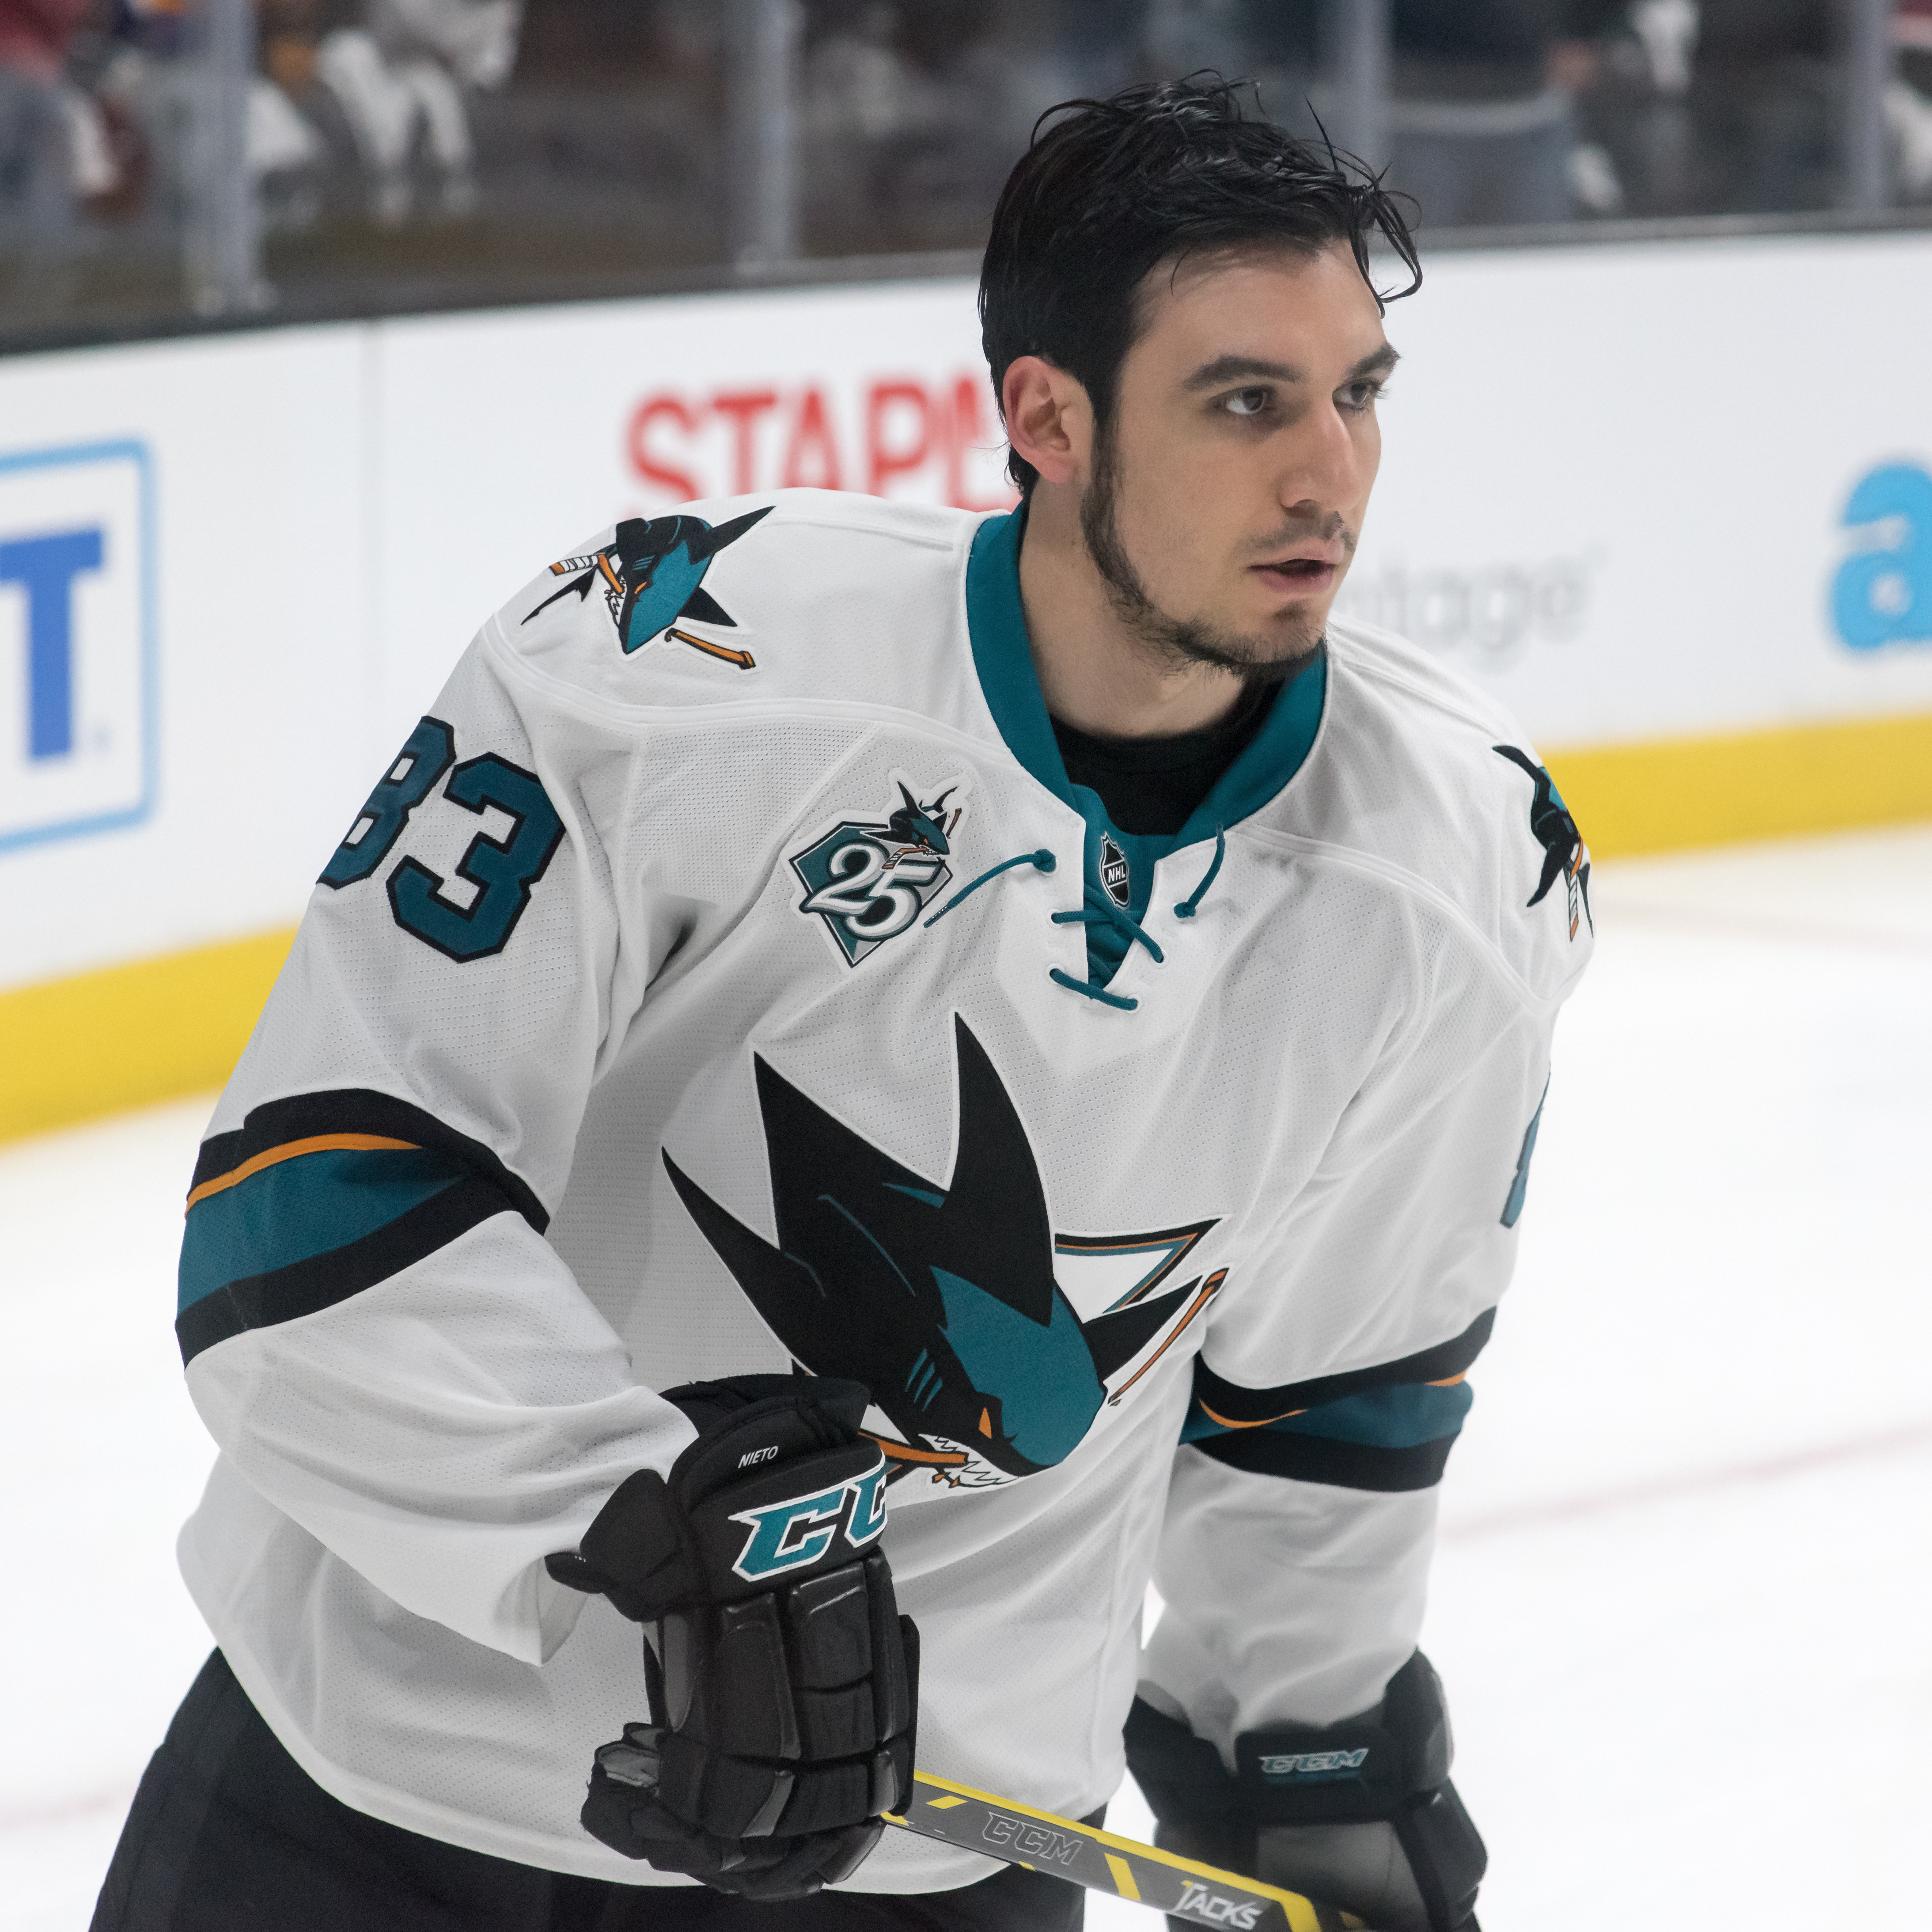
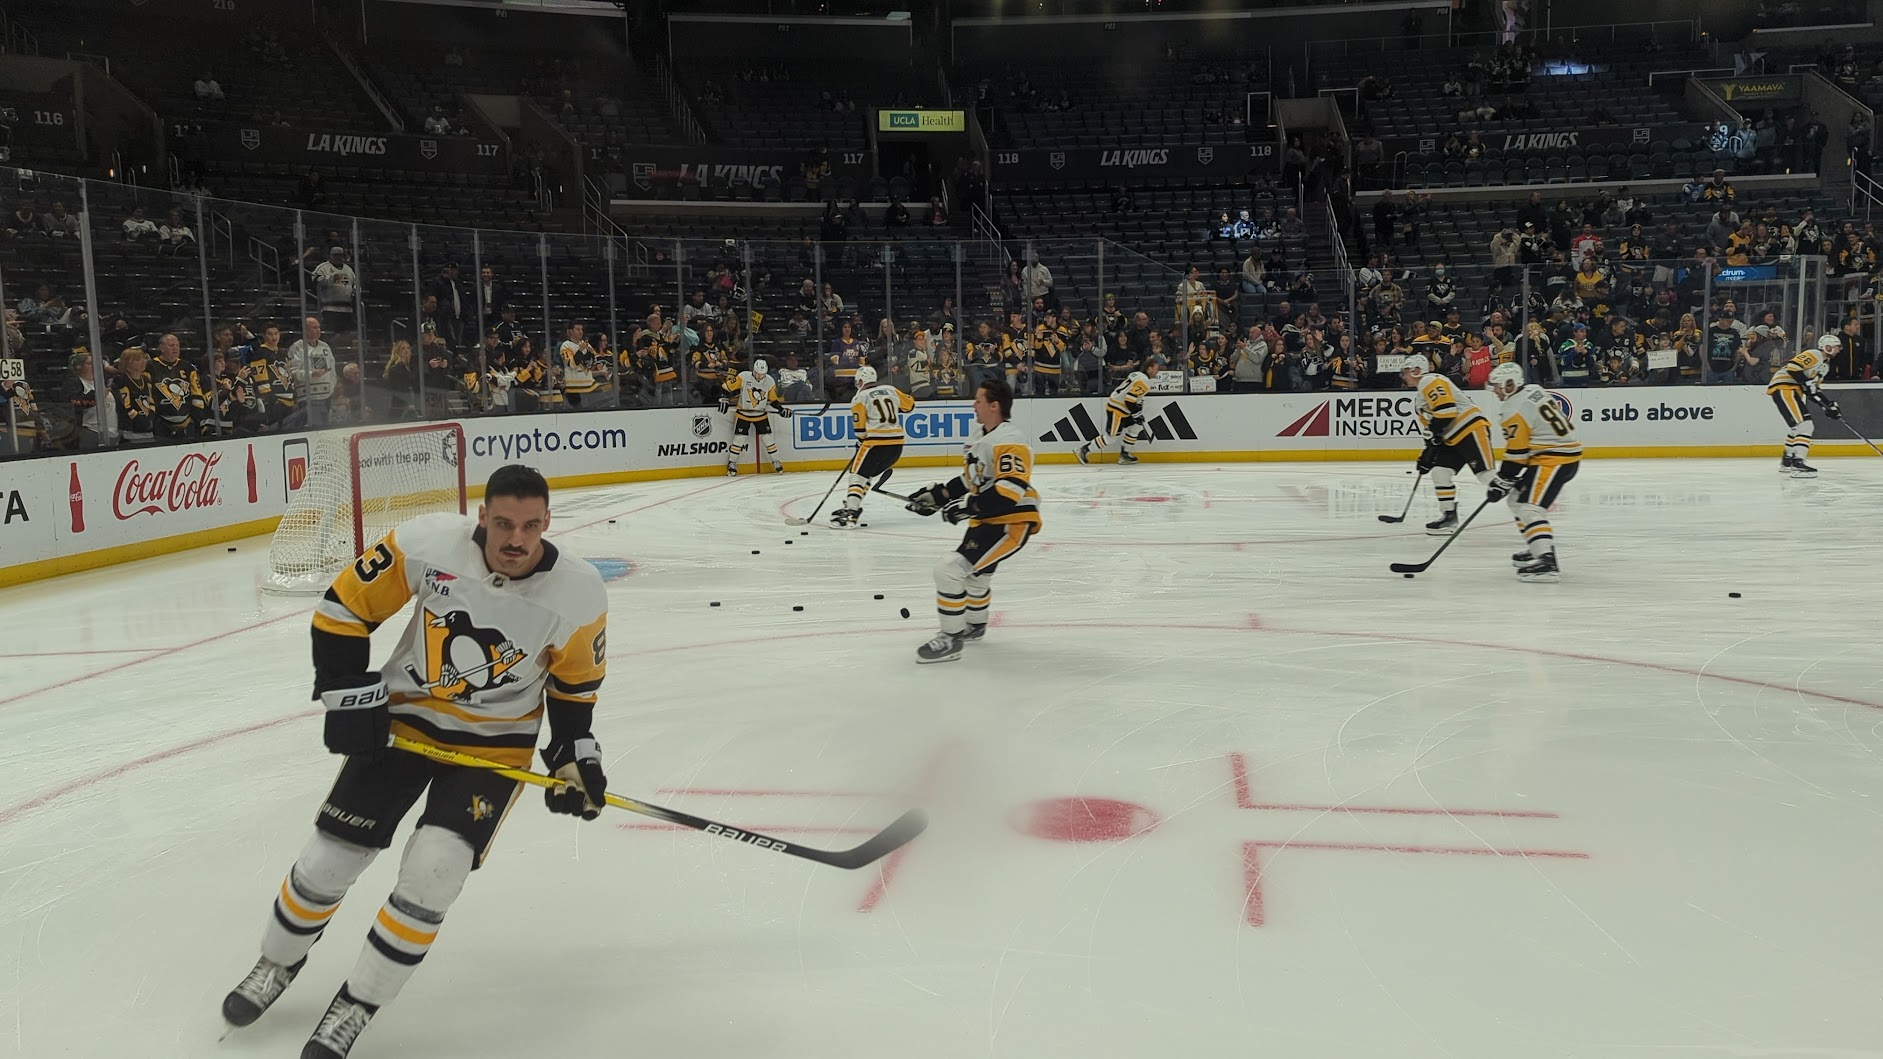

Facts drawn from Wikipédia, told in our own words.
Advanced stats
- TOI/GP
- 12:15
- PP TOI/GP
- 0:02
- SH TOI/GP
- 2:03
- Pts/GP
- 0.09
- EV points
- 2
- Hits
- 39
- Blocks
- 20
- Takeaways
- 1
- Corsi % (SAT)
- 44.1 %
- Off. zone starts
- 12.6 %
- Faceoffs
- 40.0 %
Stats and photos: NHL (NHL.com)
Player ratings, 2024-25
All ratings →Fourteen ratings from 0 to 100 drawn from data, never by hand: 75 = established NHL player, 95+ = elite.
OV · OverallConfidence 63 %
58
Replacement or prospect
- SK
- Skating
- 75
- Confidence 73 %
- ST
- Strength
- 73
- Confidence 68 %
- EN
- Endurance
- 60
- Confidence 75 %
- DU
- Durability
- 58
- Confidence 73 %
- CK
- Checking
- 73
- Confidence 68 %
- FG
- Fighting
- 74
- Confidence 46 %
- DI
- Discipline
- 71
- Confidence 68 %
- FO
- Faceoffs
- —
- PA
- Passing
- 62
- Confidence 63 %
- SC
- Scoring
- 56
- Confidence 63 %
- DF
- Defense
- 79
- Confidence 59 %
- PS
- Penalty shot
- 76
- Confidence 0 %
- EX
- Experience
- 88
- Confidence 100 %
Why these ratings?Hide details
SK — Skating75
- Top speed (35 %)35.9 · 74
- Bursts > 20 mph /60 (30 %)6.677 · 81
- Distance /60 (20 %)15.9 · 67
- Speed consistency (15 %)35.1 · 73
ST — Strength73
- Contact absorbed /60 (50 %)4.851 · 80
- Body mass (50 %)-0.882 · 68
EN — Endurance60
- Ice time per game (45 %)13.4 · 66
- Total ice time (20 %)373 · 35
- Shift length (15 %)42.2 · 60
- Lowest recent ice time per game (15 %)12 · 64
- Special-teams time per game (5 %)2.217 · 76
DU — Durability58
- Share of games played (100 %)0.671 · 58
CK — Checking73
- Hits /60 (70 %)4.575 · 76
- Lowest seasonal rate (20 %)3.131 · 70
- Season volume (10 %)3.664 · 66
FG — Fighting74
- Fights per 82 games (100 %)0.786 · 74
DI — Discipline71
- Net penalty value /60 (50 %)-0.001 · 69
- Penalties taken /60 (30 %)0.477 · 84
- Penalties drawn /60 (20 %)0.473 · 56
PA — Passing62
- Primary assists /60 (40 %)0.473 · 56
- Secondary assists /60 (20 %)0.359 · 63
- Offensive creation (RAPM) (20 %)0.037 · 70
- Power-play points /60 (10 %)4.92 · 82
- Assist consistency (10 %)0.28 · 59
SC — Scoring56
- Goals /60 (25 %)0.628 · 57
- Individual xG /60 (20 %)0.666 · 54
- Finishing (goals − xG per shot) (20 %)-0.158 · 71
- High-danger chances /60 (15 %)1.042 · 64
- xG per shot (10 %)0.078 · 73
- Shot attempts /60 (10 %)10.9 · 50
DF — Defense79
- RAPM defense /60 (35 %)0.036 · 78
- Relative xG against (20 %)-0.128 · 80
- On-ice xG against /60 (15 %)2.501 · 80
- Penalty kill /60 (10 %)-0.023 · 60
- Takeaways − giveaways /60 (10 %)-0.993 · 75
- Shot attempts against /60 (5 %)58.2 · 79
- Blocked shots /60 (5 %)2.523 · 78
PS — Penalty shot76
- Shootouts (60 %)32.7 · 76
- Penalty shots (40 %)29.3 · 76
EX — Experience88
- Career regular-season games (65 %)93
- Career playoff games (25 %)78
- NHL seasons (10 %)87
OV — Overall58
- SC · Scoring (28 %)56
- PA · Passing (22 %)62
- DF · Defense (18 %)79
- SK · Skating (12 %)75
- EN · Endurance (8 %)60
- DI · Discipline (5 %)71
- ST · Strength (4 %)73
- CK · Checking (3 %)73
| Season | OV | SK | SC | DF |
|---|---|---|---|---|
| 2024-25 | 58 | 75 | 56 | 79 |
| 2023-24 | 64 | 76 | 66 | 74 |
| 2022-23 | 66 | 81 | 67 | 77 |
The bars show confidence (sample size), not player quality. — : not enough data, not a zero. Engine version 1.0.
WAR and PAL ratings, 2024-25
How we rate →PAL Rating scores performance from 0 to 100 against players at the same position (50 = average player), starting from the player's strength, offensive or defensive. Value Rating compares that performance with what the player costs: 50 means paid what the play is worth.
WAR
-0.1
wins above replacement
459 of 596
PAL Rating
20/ 100
Performance · Below average
355 of 451 at the position
Value Rating
—/ 100
Season cap hit unknown
ProfileDefensiveValue comes mostly from defense
- Offense
- 5
- Defense
- 66
See full detailsHide details
- Offense
- 3
- Creation
- 8
- Shooting
- 4
- Possession
- 26
- Defense
- 72
- Discipline
- 28
- Power play
- 54
- Penalty kill
- 79
From 0 to 100; 50 is the average player at the same position, adjusted for ice time.
| Season | Team | WAR | PAL | Value | Cap hit |
|---|---|---|---|---|---|
| 2024-25 | PIT | -0.1 | 20 | — | — |
| 2023-24 | PIT | -0.1 | 14 | — | — |
| 2022-23 | COL | 0.6 | 34 | — | — |
WAR, 2024-25
How it's calculated →Wins added to the team, compared with a replacement-level player called up from the AHL.
-0.1
wins above replacement
-0.5 to 0.4 — 90% interval
459 of 596 forwards
-0.5 goals above replacement
Full leaderboard →See full detailsHide details
- EV offense
- -0.3
- EV defense
- +0.5
- Power play
- -0.0
- Penalty kill
- -0.1
- Shooting
- -1.3
- Penalties
- -0.2
- Average → replacement
- +1.0
In goals.
| Season | Team | GP | WAR | 90% interval | Rank |
|---|---|---|---|---|---|
| 2024-25 | PIT | 31 | -0.1 | -0.5 to 0.4 | 459/596 |
| 2023-24 | PIT | 22 | -0.1 | -0.3 to 0.1 | 461/608 |
| 2022-23 | COL | 81 | 0.6 | -0.1 to 1.4 | 194/617 |
Player tracking (NHL EDGE)
League EDGE leaderboards →Speed, shot power, distance covered, time by zone: measured by chips in the puck and shoulder pads. 90th percentile = better than 90% of players.
- Hardest shot
- 136.8 km/h44th percentileleague avg. 135.1 km/h
- Top skating speed
- 36.1 km/h58th percentileleague avg. 35.7 km/h
- Bursts over 20 mph, season
- 5144th percentileleague avg. 76
- Offensive zone time
- 38.4 %8th percentileleague avg. 42.3 %
See full detailsHide details
- Total distance, season
- 99.4 km32nd percentileleague avg. 204.5 km
- Distance, single-game high
- 3.89 km25th percentileleague avg. 4.67 km
- Offensive zone at 5v5
- 40.7 %40th percentileleague avg. 41.3 %
- Neutral zone time
- 16.4 %0th percentileleague avg. 17.8 %
- Defensive zone time
- 45.2 %4th percentileleague avg. 39.8 %
Shooting
| Shots on goal | Goals | Shooting % | |
|---|---|---|---|
| All | 3130th percentile | 118th percentile | 3.2 %0th percentile |
| High danger | 1029th percentile | 121st percentile | 10.0 %4th percentile |
| Mid range | 728th percentile | 00th percentile | 0.0 %0th percentile |
| Long range | 644th percentile | 00th percentile | 0.0 %0th percentile |
Shots on goal by zone
2024-2025 regular season. Measured by puck and player tracking chips; the percentile ranks the player within the league.
Last 5 games
| Date | Opponent | G | A | PTS | +/- | TOI |
|---|---|---|---|---|---|---|
| April 8, 2025 | vs CHI | 0 | 0 | 0 | 0 | 12:55 |
| February 23, 2025 | vs NYR | 0 | 0 | 0 | -1 | 10:41 |
| February 22, 2025 | vs WSH | 0 | 0 | 0 | -3 | 12:27 |
| February 8, 2025 | @ PHI | 0 | 0 | 0 | -1 | 11:35 |
| January 27, 2025 | @ SJS | 0 | 0 | 0 | 0 | 10:28 |
Matt Nieto: frequently asked questions
How many goals does Matt Nieto have in 2024-25?
Matt Nieto has 1 goal and 3 points (2 assists) in 32 games in 2024-25.
How old is Matt Nieto?
Matt Nieto is 33 years old: he was born on November 5, 1992.
How tall is Matt Nieto, and how much does he weigh?
Matt Nieto is 5'11" (180 cm) and weighs 190 lb (86 kg).
Where is Matt Nieto from?
United States: Matt Nieto was born in Long Beach, California, United States.
How good is Matt Nieto?
Matt Nieto produced -0.1 wins above replacement (WAR) in 2024-25, 459th of 596 players at his position in the NHL. His PAL rating is 20 out of 100: below average for his position.
Is Matt Nieto a top-10 player at his position?
No: by WAR, he ranks 459th of 596 players at his position in the NHL in 2024-25. Our comparison tool puts him side by side with any other player.
Is Matt Nieto getting better?
Yes: his PAL rating went from 14 in 2023-24 to 20 in 2024-25 (out of 100, 50 = average player at his position).
What are Matt Nieto's career stats?
Over his NHL career, Matt Nieto has 705 games, 87 goals, 119 assists and 206 points. His best season: 2014-15, with 27 points in 72 games.
Where was Matt Nieto drafted?
Matt Nieto was drafted 47th overall (round 2) by San Jose Sharks in 2011.
How does Matt Nieto perform in the playoffs?
In the playoffs, Matt Nieto has 62 games and 21 points in his career. His pace (0.34 points per game) is similar to his regular-season pace (0.29).
What is Matt Nieto's nationality?
Matt Nieto is American. Internationally: United States — gold medals at the IIHF World U18 Championships in 2009 and 2010.
How many championships has Matt Nieto won?
2: Gold medal, IIHF World U18 Championship — 2009 (Team USA); Gold medal, IIHF World U18 Championship — 2010 (Team USA).
Where did Matt Nieto play before turning pro?
Salisbury School (prep school); USA Hockey National Team Development Program (2008–09); Boston University (Terriers), finished collegiate career with 44 goals and 102 points in 115 games.
NHL.com ↗ · Stats and photos: NHL (NHL.com)