




Stats 2019-20
Edmonton Oilers
17-3-337 PTS1st in the Pacific divisionNHL
Playoff odds
>99%
Power play
35.1 %
Penalty kill
80.3 %
Goals per game
3.96
Goals against
2.61
Faceoffs
49.8 %
Team leaders
Points
 Leon Draisaitl110
Goals
Leon Draisaitl43Assists
Leon Draisaitl67+/-
 Kailer Yamamoto+17
Power-play points
Leon Draisaitl44Hits
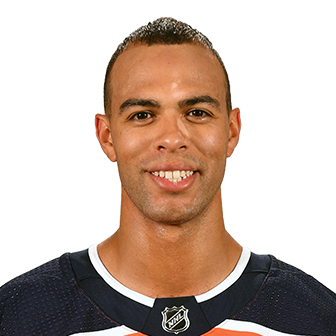 Darnell Nurse172
Wins
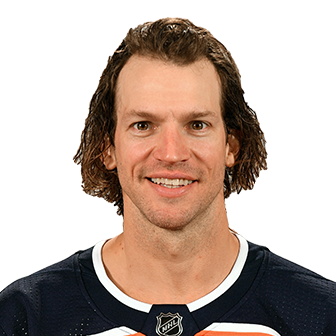 Mike Smith19
Save %
 Mikko Koskinen.917
- 2. Mike Smith.902
Players (31)
| Player | |||||
|---|---|---|---|---|---|
| Leon DraisaitlC | 71 | 43 | 67 | 110 | -7 |
| Connor McDavidC | 64 | 34 | 63 | 97 | -6 |
| Ryan Nugent-HopkinsC | 65 | 22 | 39 | 61 | +1 |
| Zack KassianR | 59 | 15 | 19 | 34 | 0 |
| Oscar KlefbomD | 62 | 5 | 29 | 34 | -17 |
| Darnell NurseD | 71 | 5 | 28 | 33 | -2 |
| James NealL | 55 | 19 | 12 | 31 | -20 |
| Kailer YamamotoR | 27 | 11 | 15 | 26 | +17 |
| Alex ChiassonR | 65 | 11 | 13 | 24 | -3 |
| Josh ArchibaldR | 62 | 12 | 9 | 21 | -8 |
| Ethan BearD | 71 | 5 | 16 | 21 | -4 |
| Riley SheahanC | 66 | 8 | 7 | 15 | -13 |
| Sam GagnerC | 36 | 5 | 7 | 12 | -9 |
| Jujhar KhairaL | 64 | 6 | 4 | 10 | -19 |
| Gaetan HaasC | 58 | 5 | 5 | 10 | -1 |
| Kris RussellD | 55 | 0 | 9 | 9 | 0 |
| Caleb JonesD | 43 | 4 | 5 | 9 | -1 |
| Joakim NygardL | 33 | 3 | 6 | 9 | 0 |
| Matt BenningD | 43 | 1 | 7 | 8 | +8 |
| Adam LarssonD | 49 | 1 | 5 | 6 | 0 |
| Patrick RussellR | 45 | 0 | 5 | 5 | -11 |
| Tyler EnnisR | 9 | 2 | 2 | 4 | -1 |
| Markus GranlundC | 34 | 3 | 1 | 4 | -1 |
| Tomas JurcoR | 12 | 0 | 2 | 2 | +1 |
| Andreas AthanasiouC | 9 | 1 | 1 | 2 | -1 |
| Joel PerssonD | 13 | 0 | 2 | 2 | -1 |
| Brandon ManningD | 9 | 1 | 0 | 1 | -1 |
| Colby CaveC | 11 | 1 | 0 | 1 | -3 |
| Tyler BensonL | 7 | 0 | 1 | 1 | -1 |
| Mike GreenD | 2 | 0 | 0 | 0 | -2 |
| William LagessonD | 8 | 0 | 0 | 0 | -4 |
Stats and photos: NHL (NHL.com)