




Stats 2018-19
Edmonton Oilers
17-3-337 PTS1st in the Pacific divisionNHL
Playoff odds
>99%
Power play
35.1 %
Penalty kill
80.3 %
Goals per game
3.96
Goals against
2.61
Faceoffs
49.8 %
Team leaders
Points
 Connor McDavid116
Goals
 Leon Draisaitl50
Assists
Connor McDavid75+/-
 Matt Benning+11
Power-play points
Connor McDavid33Hits
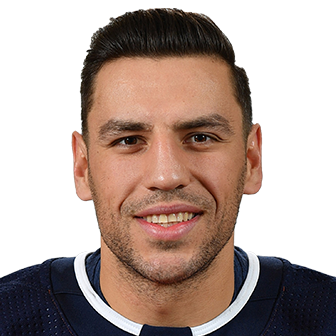 Milan Lucic259
Wins
 Mikko Koskinen25
Save %
Mikko Koskinen.906- 2. Cam Talbot.893
Players (36)
| Player | |||||
|---|---|---|---|---|---|
| Connor McDavidC | 78 | 41 | 75 | 116 | +3 |
| Leon DraisaitlC | 82 | 50 | 55 | 105 | +2 |
| Ryan Nugent-HopkinsC | 82 | 28 | 41 | 69 | -13 |
| Darnell NurseD | 82 | 10 | 31 | 41 | -5 |
| Alex ChiassonR | 73 | 22 | 16 | 38 | -1 |
| Oscar KlefbomD | 61 | 5 | 23 | 28 | -11 |
| Zack KassianR | 79 | 15 | 11 | 26 | -6 |
| Milan LucicL | 79 | 6 | 14 | 20 | -9 |
| Adam LarssonD | 82 | 3 | 17 | 20 | -28 |
| Jujhar KhairaL | 60 | 3 | 15 | 18 | -12 |
| Matt BenningD | 70 | 5 | 12 | 17 | +11 |
| Kris RussellD | 72 | 3 | 13 | 16 | +5 |
| Tobias RiederL | 67 | 0 | 11 | 11 | -8 |
| Ty RattieR | 50 | 4 | 7 | 11 | -2 |
| Drake CaggiulaL | 29 | 7 | 4 | 11 | -8 |
| Sam GagnerC | 25 | 5 | 5 | 10 | -3 |
| Kyle BrodziakC | 70 | 6 | 3 | 9 | -14 |
| Jesse PuljujarviR | 46 | 4 | 5 | 9 | -14 |
| Caleb JonesD | 17 | 1 | 5 | 6 | -9 |
| Josh CurrieR | 21 | 2 | 3 | 5 | +2 |
| Andrej SekeraD | 24 | 0 | 4 | 4 | +3 |
| Ryan SpoonerC | 25 | 2 | 1 | 3 | -6 |
| Kevin GravelD | 36 | 0 | 3 | 3 | -2 |
| Colby CaveC | 33 | 2 | 1 | 3 | -4 |
| Joseph GambardellaC | 15 | 0 | 3 | 3 | +2 |
| Chris WidemanD | 5 | 0 | 2 | 2 | -2 |
| Ryan StromeC | 18 | 1 | 1 | 2 | -1 |
| Kailer YamamotoR | 17 | 1 | 1 | 2 | -6 |
| Jason GarrisonD | 17 | 1 | 0 | 1 | +1 |
| Brandon ManningD | 12 | 1 | 0 | 1 | -1 |
| Alexander PetrovicD | 9 | 0 | 1 | 1 | -7 |
| Evan BouchardD | 7 | 1 | 0 | 1 | -5 |
| Brad MaloneC | 16 | 0 | 0 | 0 | 0 |
| Valentin ZykovL | 5 | 0 | 0 | 0 | -1 |
| Cooper MarodyC | 6 | 0 | 0 | 0 | -1 |
| Patrick RussellR | 6 | 0 | 0 | 0 | 0 |
Stats and photos: NHL (NHL.com)