




Stats 2011-12
Edmonton Oilers
17-3-337 PTS1st in the Pacific divisionNHL
Playoff odds
>99%
Power play
35.1 %
Penalty kill
80.3 %
Goals per game
3.96
Goals against
2.61
Faceoffs
49.8 %
Team leaders
Points
 Jordan Eberle76
Goals
Jordan Eberle34Assists
Jordan Eberle42+/-
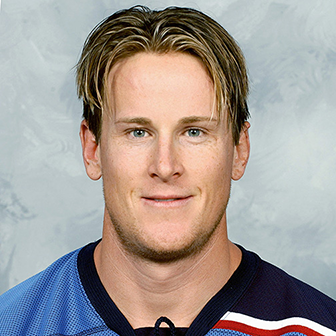 Andy Sutton+5
Power-play points
 Ryan Nugent-Hopkins23
Hits
 Ladislav Smid186
Wins
 Devan Dubnyk20
Save %
Devan Dubnyk.914
Players (34)
| Player | |||||
|---|---|---|---|---|---|
| Jordan EberleR | 78 | 34 | 42 | 76 | +4 |
| Taylor HallL | 61 | 27 | 26 | 53 | -3 |
| Ryan Nugent-HopkinsC | 62 | 18 | 34 | 52 | -2 |
| Sam GagnerC | 75 | 18 | 29 | 47 | +5 |
| Ryan SmythL | 82 | 19 | 27 | 46 | -5 |
| Ales HemskyR | 69 | 10 | 26 | 36 | -13 |
| Shawn HorcoffC | 81 | 13 | 21 | 34 | -23 |
| Ryan JonesL | 79 | 17 | 16 | 33 | -7 |
| Jeff PetryD | 73 | 2 | 23 | 25 | -7 |
| Corey PotterD | 62 | 4 | 17 | 21 | -16 |
| Ryan WhitneyD | 51 | 3 | 17 | 20 | -16 |
| Tom GilbertD | 47 | 3 | 14 | 17 | -3 |
| Eric BelangerC | 78 | 4 | 12 | 16 | -13 |
| Ladislav SmidD | 78 | 5 | 10 | 15 | +4 |
| Ben EagerL | 63 | 8 | 5 | 13 | -1 |
| Andy SuttonD | 52 | 3 | 7 | 10 | +5 |
| Lennart PetrellL | 60 | 4 | 5 | 9 | -10 |
| Magnus PaajarviL | 41 | 2 | 6 | 8 | -7 |
| Anton LanderC | 56 | 2 | 4 | 6 | -8 |
| Teemu HartikainenC | 17 | 2 | 3 | 5 | +1 |
| Nick SchultzD | 20 | 0 | 4 | 4 | -2 |
| Darcy HordichukL | 43 | 1 | 2 | 3 | -3 |
| Theo PeckhamD | 54 | 1 | 2 | 3 | 0 |
| Linus OmarkL | 14 | 3 | 0 | 3 | -5 |
| Josh GreenC | 7 | 1 | 1 | 2 | -6 |
| Cam BarkerD | 25 | 2 | 0 | 2 | 0 |
| Ryan O'MarraC | 7 | 0 | 1 | 1 | 0 |
| Chris VandeVeldeC | 5 | 1 | 0 | 1 | +2 |
| Alex PlanteD | 3 | 0 | 1 | 1 | 0 |
| Colten TeubertD | 24 | 0 | 1 | 1 | -5 |
| Philippe CornetL | 2 | 0 | 1 | 1 | 0 |
| Bryan RodneyD | 1 | 0 | 0 | 0 | -1 |
| Taylor ChorneyD | 3 | 0 | 0 | 0 | -1 |
| Milan KytnarC | 1 | 0 | 0 | 0 | 0 |
Stats and photos: NHL (NHL.com)