




Stats 2017-18
Boston Bruins
14-7-129 PTS4th in the Atlantic divisionNHL
Playoff odds
80%
Power play
19.1 %
Penalty kill
81.1 %
Goals per game
3.41
Goals against
2.55
Faceoffs
56.0 %
Team leaders
Points
 Brad Marchand85
Goals
 David Pastrnak35
Assists
Brad Marchand51+/-
Brad Marchand+25Power-play points
David Pastrnak26Hits
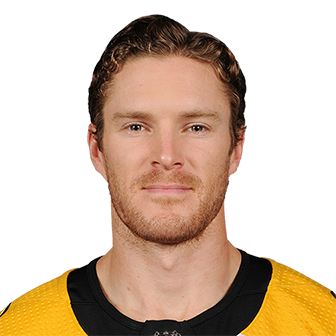 Kevan Miller164
Wins
 Tuukka Rask34
Save %
Tuukka Rask.917
Players (35)
| Player | |||||
|---|---|---|---|---|---|
| Brad MarchandL | 68 | 34 | 51 | 85 | +25 |
| David PastrnakR | 82 | 35 | 45 | 80 | +10 |
| Patrice BergeronC | 64 | 30 | 33 | 63 | +21 |
| Torey KrugD | 76 | 14 | 45 | 59 | 0 |
| Danton HeinenL | 77 | 16 | 31 | 47 | +10 |
| David KrejciC | 64 | 17 | 27 | 44 | +10 |
| Jake DeBruskL | 70 | 16 | 27 | 43 | +13 |
| Riley NashC | 76 | 15 | 26 | 41 | +16 |
| David BackesR | 57 | 14 | 19 | 33 | +2 |
| Charlie McAvoyD | 63 | 7 | 25 | 32 | +20 |
| Ryan SpoonerC | 39 | 9 | 16 | 25 | +10 |
| Zdeno CharaD | 73 | 7 | 17 | 24 | +22 |
| Tim SchallerL | 82 | 12 | 10 | 22 | -5 |
| Kevan MillerD | 68 | 1 | 15 | 16 | +16 |
| Matt GrzelcykD | 61 | 3 | 12 | 15 | +21 |
| Sean KuralyC | 75 | 6 | 8 | 14 | -5 |
| Anders BjorkL | 30 | 4 | 8 | 12 | +2 |
| Noel AcciariC | 60 | 10 | 1 | 11 | -6 |
| Ryan DonatoC | 12 | 5 | 4 | 9 | +2 |
| Brian GiontaR | 20 | 2 | 5 | 7 | -1 |
| Rick NashL | 11 | 3 | 3 | 6 | -4 |
| Brandon CarloD | 76 | 0 | 6 | 6 | +10 |
| Nick HoldenD | 18 | 1 | 4 | 5 | -2 |
| Tommy WingelsC | 18 | 2 | 3 | 5 | -1 |
| Adam McQuaidD | 38 | 1 | 3 | 4 | -1 |
| Austin CzarnikC | 10 | 0 | 4 | 4 | -1 |
| Jordan SzwarzC | 12 | 0 | 3 | 3 | -4 |
| Peter CehlarikL | 6 | 1 | 1 | 2 | +2 |
| Frank VatranoR | 25 | 2 | 0 | 2 | -3 |
| Paul PostmaD | 14 | 0 | 1 | 1 | -2 |
| Kenny AgostinoL | 5 | 0 | 1 | 1 | -1 |
| Matt BeleskeyL | 14 | 0 | 0 | 0 | -8 |
| Rob O'GaraD | 8 | 0 | 0 | 0 | -5 |
| Anton BlidhL | 1 | 0 | 0 | 0 | 0 |
| Colby CaveC | 3 | 0 | 0 | 0 | 0 |
Stats and photos: NHL (NHL.com)