




Stats 2002-03
Boston Bruins
14-7-129 PTS4th in the Atlantic divisionNHL
Playoff odds
80%
Power play
19.1 %
Penalty kill
81.1 %
Goals per game
3.41
Goals against
2.55
Faceoffs
56.0 %
Team leaders
Points
 Joe Thornton101
Goals
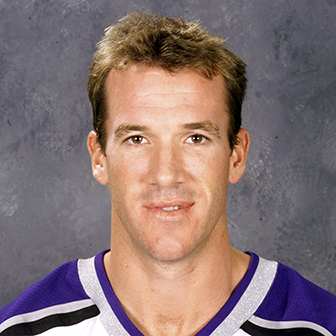 Glen Murray44
Assists
Joe Thornton65+/-
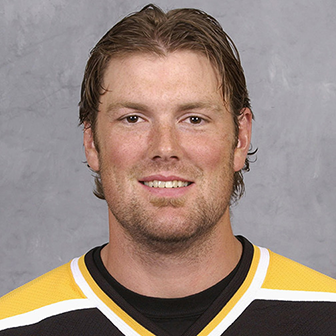 Hal Gill+21
Power-play points
Joe Thornton34Wins
 Steve Shields12
Save %
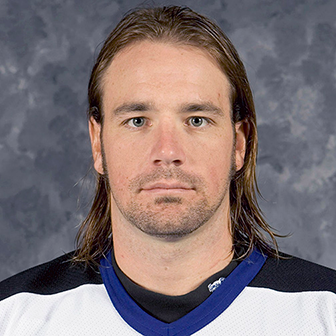 John Grahame.902
- 2. Steve Shields.896
- 3. Jeff Hackett.894
Players (33)
| Player | |||||
|---|---|---|---|---|---|
| Joe ThorntonC | 77 | 36 | 65 | 101 | +12 |
| Glen MurrayR | 82 | 44 | 48 | 92 | +9 |
| Brian RolstonR | 81 | 27 | 32 | 59 | +1 |
| Mike KnubleR | 75 | 30 | 29 | 59 | +18 |
| Jozef StumpelL | 78 | 14 | 37 | 51 | 0 |
| Bryan BerardD | 80 | 10 | 28 | 38 | -4 |
| P.J. AxelssonL | 66 | 17 | 19 | 36 | +8 |
| Nick BoyntonD | 78 | 7 | 17 | 24 | +8 |
| Jonathan GirardD | 73 | 6 | 16 | 22 | +4 |
| Michal GrosekL | 63 | 2 | 18 | 20 | +2 |
| Marty McinnisL | 77 | 9 | 10 | 19 | -11 |
| Martin LapointeR | 59 | 8 | 10 | 18 | -19 |
| Hal GillD | 76 | 4 | 13 | 17 | +21 |
| Ivan HumlL | 41 | 6 | 11 | 17 | +3 |
| Rob ZamunerL | 55 | 10 | 6 | 16 | +2 |
| Sean O'DonnellD | 70 | 1 | 15 | 16 | +8 |
| Sergei SamsonovL | 8 | 5 | 6 | 11 | +8 |
| P.J. StockC | 71 | 1 | 9 | 10 | -5 |
| Don SweeneyD | 67 | 3 | 5 | 8 | -1 |
| Sean BrownD | 69 | 1 | 5 | 6 | -6 |
| Lee GorenR | 14 | 2 | 1 | 3 | -2 |
| Andy HilbertL | 14 | 0 | 3 | 3 | -1 |
| Ian MoranD | 8 | 0 | 1 | 1 | -1 |
| Rich BrennanD | 7 | 0 | 1 | 1 | +3 |
| Dan McgillisD | 10 | 0 | 1 | 1 | +2 |
| Martin SamuelssonL | 8 | 0 | 1 | 1 | -1 |
| Kris VernarskyC | 14 | 1 | 0 | 1 | -2 |
| Zdenek KutlakD | 4 | 1 | 0 | 1 | 0 |
| Brantt MyhresR | 1 | 0 | 0 | 0 | 0 |
| Krzysztof OliwaL | 33 | 0 | 0 | 0 | -4 |
| Matthew HerrC | 3 | 0 | 0 | 0 | 0 |
| Jarno KultanenD | 2 | 0 | 0 | 0 | +1 |
| Shaone MorrisonnD | 11 | 0 | 0 | 0 | 0 |
Stats and photos: NHL (NHL.com)