



Michael
Bunting
L · PHI · Balanced · Around average
- PAL
- 48
- WAR
- 1.0
- PTS
- 2
2025-26№ 168 / 615
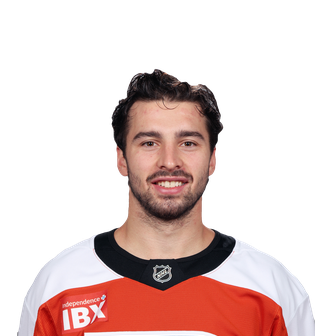
Michael Bunting (Philadelphia Flyers) stats and profile: offensive production, ice time, advanced stats, WAR and PAL rating.
Michael Bunting
#58LPlays: Left wing · 0% of faceoffs Philadelphia Flyers
HEIGHT : 183 cm · WEIGHT : 84 kg · SHOOTS : L
Born : September 16, 1995 · Scarborough, Canada
Drafted : 2014 · ARI · round 4, pick #117
NHL record
| Year | Team | GP | G | A | PTS | PIM |
|---|---|---|---|---|---|---|
| 2026-27 | Philadelphia Flyers | 12 | 1 | 1 | 2 | 6 |
| 2025-26 | Dallas Stars | 13 | 1 | 1 | 2 | 4 |
| 2025-26 | Nashville Predators | 61 | 13 | 18 | 31 | 16 |
| 2024-25 | Nashville Predators | 18 | 5 | 4 | 9 | 20 |
| 2024-25 | Pittsburgh Penguins | 58 | 14 | 15 | 29 | 48 |
| 2023-24 | Pittsburgh Penguins | 21 | 6 | 13 | 19 | 2 |
| 2023-24 | Carolina Hurricanes | 60 | 13 | 23 | 36 | 55 |
| 2022-23 | Toronto Maple Leafs | 82 | 23 | 26 | 49 | 103 |
| 2021-22 | Toronto Maple Leafs | 79 | 23 | 40 | 63 | 80 |
| 2020-21 | Arizona Coyotes | 21 | 10 | 3 | 13 | 12 |
| 2018-19 | Arizona Coyotes | 5 | 1 | 0 | 1 | 2 |
| NHL totals | 430 | 110 | 144 | 254 | 348 | |
Playoffs
| Year | Team | GP | G | A | PTS | PIM |
|---|---|---|---|---|---|---|
| 2025-26 | Dallas Stars | 1 | 0 | 1 | 1 | 0 |
| 2022-23 | Toronto Maple Leafs | 7 | 1 | 1 | 2 | 15 |
| 2021-22 | Toronto Maple Leafs | 6 | 1 | 2 | 3 | 4 |
| Playoff totals | 14 | 2 | 4 | 6 | 19 | |
Michael Bunting: our analysis
2025-26 season: 13 GP, 1 G, 1 A, 2 PTS, -7 +/-, 12:48 TOI. WAR 1.0 (168th of 615) · PAL 48, around average.
In 2025-26, Michael Bunting, 31, posts a PAL Rating of 48 out of 100 (around average), and his WAR of 1.0 ranks 168th among 615 regulars, in the top half.
His strengths: discipline (99, among the best in the league), penalty kill (70, above average) and creation (65, above average). On the other hand, defense (22, well below average) holds him back.
Breaking down his WAR (goals above average), his biggest contribution: penalties (+2.9); his biggest cost: EV defense (-1.4).
A marked decline: his PAL was 59 in 2024-25, against 48 now; his WAR, though, went from 0.1 to 1.0.
Michael Bunting's story
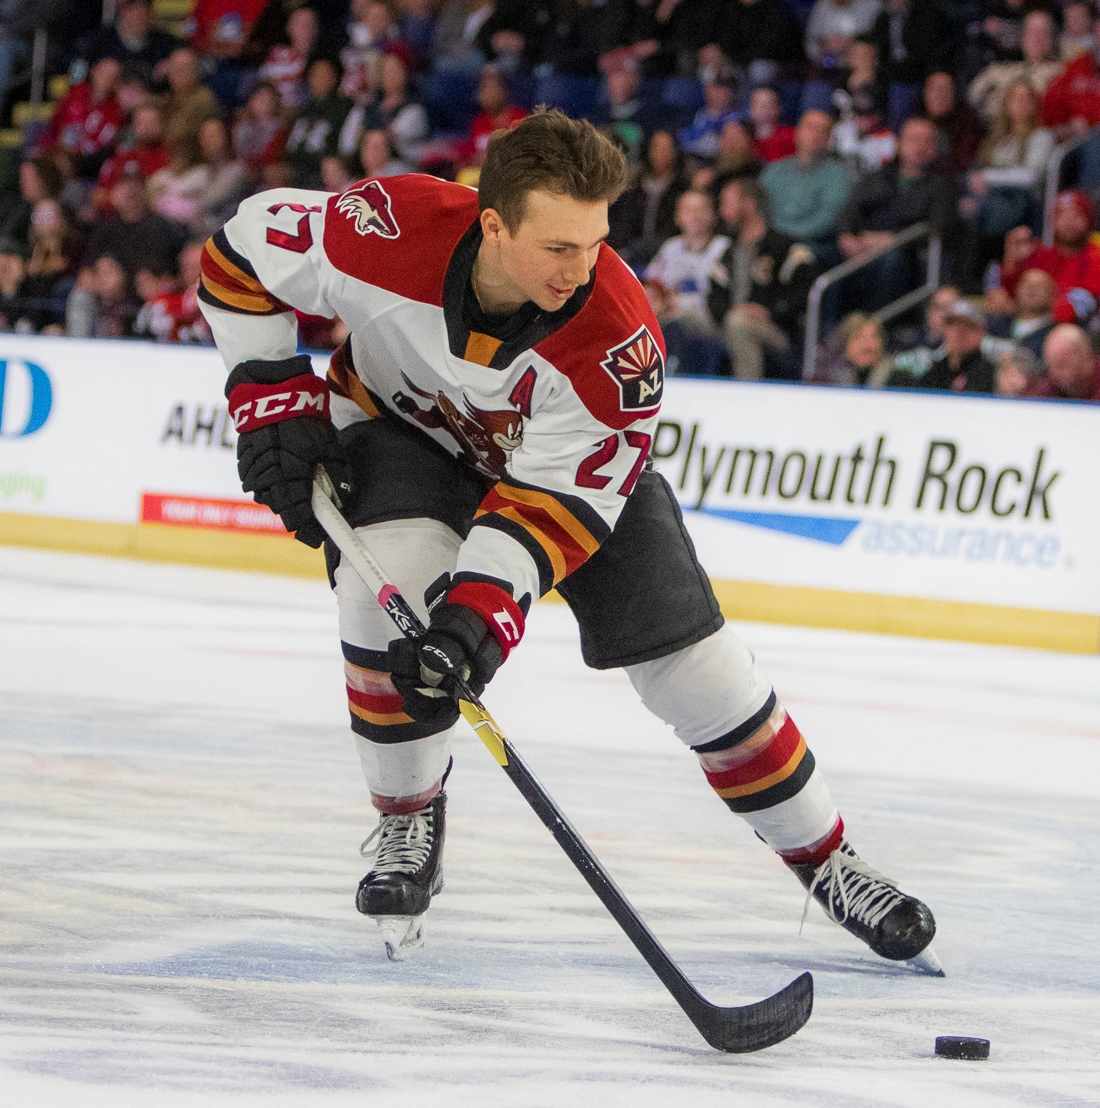
Growing up in Scarborough, Michael Bunting worked his way up without the usual AAA résumé: after playing midget with the Don Mills Flyers he was noticed by an OHL scout and taken 160th overall in the 2013 OHL Priority Selection by the Sault Ste. Marie Greyhounds. As a rookie he produced offensively and followed that with a 37‑goal campaign in 2014–15, a season that established him as a consistent scorer at the junior level.
Selected 117th overall by the Arizona Coyotes in the 2014 NHL Entry Draft, Bunting signed an entry‑level deal in July 2015 and began his pro career in the AHL with the Springfield Falcons. A short stint in the ECHL gave him his first professional goal before he settled into the AHL. With the Tucson Roadrunners in 2017–18 he reached 23 goals and 43 points and later became the Roadrunners’ all‑time leader in games, goals, assists, points and penalty minutes.
Bunting’s AHL production led to NHL recalls beginning in December 2018; he scored in his NHL debut on December 11, 2018. After moving between Tucson and Arizona for several seasons, he broke through in 2020–21 when he remained with the Coyotes from late March, notching a goal and an assist in his season return and recording his first NHL hat‑trick on April 5, 2021. That stretch helped cement his place at the top level.
His NHL journey continued through stints in Toronto, Carolina, Pittsburgh, Nashville and Dallas, including trades that moved him between clubs and moments that shaped his career trajectory. Internationally, Bunting earned his first senior Team Canada invitation in 2021 and was part of the Canadian group that reached and won the IIHF World Championship gold that year.
On the ice, Bunting is defined by a high‑energy style: a forward who draws attention, creates power‑play opportunities by drawing penalties and finishes chances. He pairs physical engagement with goal scoring instincts, attributes that have carried him from midget hockey to multiple NHL rosters.

Facts drawn from Wikipédia, told in our own words.
Advanced stats
- TOI/GP
- 10:49
- PP TOI/GP
- 1:03
- SH TOI/GP
- 0:00
- Pts/GP
- 0.17
- EV points
- 1
- Hits
- 9
- Blocks
- 1
- Takeaways
- 1
- Corsi % (SAT)
- 47.9 %
- Off. zone starts
- 25.7 %
Stats and photos: NHL (NHL.com)
2026-27 projection
Projected points
23between 8 and 38 (80% range)
- Goals
- 9
- Assists
- 13
- Games
- 63
So far: 2 pts in 12 games. The team has played 24 of 84 games. Projected pace: 0.40 pts per game (last season: 0.45).
The projection follows last season's pace. Tested on 2,265 player seasons (2022-23 to 2025-26): average miss of 9 points over 82 games; for players at 0.9 points per game and up, it ran 5 points high on average.
Trend
Declining
- Points per game: 0.68 in 23-24, 0.45 in 25-26
- PAL Rating: 59 → 48
Outlook, age included
↓ DecliningAge 31: the age when production usually declines
This is only a projection. It knows nothing about injuries, trades or role changes; one player in five finishes outside the range.
Player ratings, 2025-26
All ratings →Fourteen ratings from 0 to 100 drawn from data, never by hand: 75 = established NHL player, 95+ = elite.
OV · OverallConfidence 82 %
75
Established NHL
- SK
- Skating
- 68
- Confidence 73 %
- ST
- Strength
- 63
- Confidence 85 %
- EN
- Endurance
- 75
- Confidence 80 %
- DU
- Durability
- 84
- Confidence 77 %
- CK
- Checking
- 70
- Confidence 85 %
- FG
- Fighting
- 73
- Confidence 66 %
- DI
- Discipline
- 91
- Confidence 85 %
- FO
- Faceoffs
- —
- PA
- Passing
- 78
- Confidence 82 %
- SC
- Scoring
- 77
- Confidence 82 %
- DF
- Defense
- 66
- Confidence 79 %
- PS
- Penalty shot
- 65
- Confidence 25 %
- EX
- Experience
- 76
- Confidence 100 %
Why these ratings?Hide details
SK — Skating68
- Top speed (35 %)35.8 · 72
- Bursts > 20 mph /60 (30 %)4.388 · 70
- Distance /60 (20 %)15.6 · 62
- Speed consistency (15 %)34.8 · 67
ST — Strength63
- Contact absorbed /60 (50 %)3.52 · 68
- Body mass (50 %)-0.909 · 67
EN — Endurance75
- Ice time per game (45 %)14.7 · 73
- Total ice time (20 %)1,038 · 75
- Shift length (15 %)47 · 79
- Lowest recent ice time per game (15 %)14 · 77
- Special-teams time per game (5 %)2.07 · 73
DU — Durability84
- Share of games played (100 %)0.869 · 84
CK — Checking70
- Hits /60 (70 %)3.463 · 70
- Lowest seasonal rate (20 %)2.843 · 70
- Season volume (10 %)3.829 · 69
FG — Fighting73
- Fights per 82 games (100 %)0.786 · 73
DI — Discipline91
- Net penalty value /60 (50 %)0.081 · 92
- Penalties taken /60 (30 %)0.939 · 63
- Penalties drawn /60 (20 %)1.416 · 94
PA — Passing78
- Primary assists /60 (40 %)0.864 · 82
- Secondary assists /60 (20 %)0.334 · 60
- Offensive creation (RAPM) (20 %)0.14 · 80
- Power-play points /60 (10 %)5.152 · 84
- Assist consistency (10 %)0.55 · 77
SC — Scoring77
- Goals /60 (25 %)0.917 · 74
- Individual xG /60 (20 %)0.991 · 81
- Finishing (goals − xG per shot) (20 %)-0.341 · 67
- High-danger chances /60 (15 %)1.75 · 85
- xG per shot (10 %)0.08 · 77
- Shot attempts /60 (10 %)15.8 · 80
DF — Defense66
- RAPM defense /60 (35 %)-0.09 · 62
- Relative xG against (20 %)0.079 · 69
- On-ice xG against /60 (15 %)2.657 · 73
- Penalty kill /60 (10 %)0.036 · 76
- Takeaways − giveaways /60 (10 %)-1.754 · 70
- Shot attempts against /60 (5 %)60.9 · 61
- Blocked shots /60 (5 %)1.908 · 66
PS — Penalty shot65
- Shootouts (60 %)32.8 · 83
- Penalty shots (40 %)25.4 · 57
EX — Experience76
- Career regular-season games (65 %)85
- Career playoff games (25 %)51
- NHL seasons (10 %)75
OV — Overall75
- SC · Scoring (28 %)77
- PA · Passing (22 %)78
- DF · Defense (18 %)66
- SK · Skating (12 %)68
- EN · Endurance (8 %)75
- DI · Discipline (5 %)91
- ST · Strength (4 %)63
- CK · Checking (3 %)70
| Season | OV | SK | SC | DF |
|---|---|---|---|---|
| 2025-26 | 75 | 68 | 77 | 66 |
| 2024-25 | 77 | 66 | 81 | 64 |
| 2023-24 | 79 | 65 | 83 | 56 |
| 2022-23 | 79 | 76 | 83 | 64 |
The bars show confidence (sample size), not player quality. — : not enough data, not a zero. Engine version 1.0.
WAR and PAL ratings, 2025-26 (season in progress)
How we rate →PAL Rating scores performance from 0 to 100 against players at the same position (50 = average player), starting from the player's strength, offensive or defensive. Value Rating compares that performance with what the player costs: 50 means paid what the play is worth.
PAL Rating
48/ 100
Performance · Around average
230 of 476 at the position
Value Rating
—/ 100
Season cap hit unknown
ProfileBalancedNeither end dominates
- Offense
- 56
- Defense
- 23
See full detailsHide details
- Offense
- 61
- Creation
- 65
- Shooting
- 39
- Possession
- 39
- Defense
- 22
- Discipline
- 99
- Power play
- 64
- Penalty kill
- 70
From 0 to 100; 50 is the average player at the same position, adjusted for ice time.
| Season | Team | WAR | PAL | Value | Cap hit |
|---|---|---|---|---|---|
| 2025-26 | DAL | 1.0 | 48 | — | — |
| 2024-25 | NSH | 0.1 | 59 | — | — |
| 2023-24 | PIT | -0.2 | 67 | — | — |
| 2022-23 | TOR | 0.1 | 61 | — | — |
Hockey IQ, 2025-26
Rankings and method →The quality of the player's decisions with and against the puck at 5-on-5, against regulars at the same position (50 = average). PAL measures output; IQ measures how the player plays.
Overall IQ
80/ 100
Very good
better than 80% of forwards, offense and defense combined
Offensive IQ
78/ 100
Very good
passing, shots, puck
Defensive IQ
59/ 100
Average
takeaways, discipline, own zone
Why 80, higher than both scores? Overall IQ isn't an average, it's a rank: 83 of 424 forwards. Few players are good at both ends at once; being so puts Michael Bunting ahead of almost everyone else.
See full detailsHide details
Offense
- Playmaking passes
- 85
- Shot selection
- 12
- Penalties drawn
- 97
- Puck management
- 52
Defense
- Takeaways
- 32
- Discipline
- 51
- Safe zone exits
- 83
Percentiles: 80 means better than 80% of regulars at the same position. Play without the puck (positioning, coverage) isn't measured: the NHL doesn't publish that data.
| Season | Team | IQ | Off. | Def. |
|---|---|---|---|---|
| 2025-26 | DAL | 80 | 78 | 59 |
| 2024-25 | NSH | 39 | 93 | 6 |
| 2023-24 | PIT | 92 | 99 | 32 |
| 2022-23 | TOR | 82 | 99 | 18 |
Wins added to the team, compared with a replacement-level player called up from the AHL.
-0.1
wins above replacement
-0.2 to 0.1 — 90% interval
359 of 504 forwards
-0.3 goals above replacement
Full leaderboard →See full detailsHide details
- EV offense
- +0.2
- EV defense
- -0.1
- Power play
- +0.0
- Penalty kill
- 0.0
- Shooting
- -0.9
- Penalties
- +0.2
- Average → replacement
- +0.4
In goals.
| Season | Team | GP | WAR | 90% interval | Rank |
|---|---|---|---|---|---|
| 2026-27 | PHI | 12 | -0.1 | -0.2 to 0.1 | 359/504 |
| 2025-26 | DAL | 74 | 1.0 | -0.1 to 2.1 | 168/615 |
| 2024-25 | NSH | 72 | 0.1 | -1.1 to 1.7 | 322/596 |
| 2023-24 | PIT | 81 | -0.2 | -1.0 to 1.0 | 494/608 |
| 2022-23 | TOR | 82 | 0.1 | -1.1 to 2.1 | 296/617 |
Player tracking (NHL EDGE)
League EDGE leaderboards →Speed, shot power, distance covered, time by zone: measured by chips in the puck and shoulder pads. 90th percentile = better than 90% of players.
- Hardest shot
- 124.9 km/h23rd percentileleague avg. 130.5 km/h
- Top skating speed
- 36.9 km/h89th percentileleague avg. 35.2 km/h
- Bursts over 20 mph, season
- 1537th percentileleague avg. 24
- Offensive zone time
- 41.7 %45th percentileleague avg. 42.7 %
See full detailsHide details
- Total distance, season
- 32.9 km25th percentileleague avg. 60.9 km
- Distance, single-game high
- 3.73 km23rd percentileleague avg. 4.55 km
- Offensive zone at 5v5
- 40.9 %46th percentileleague avg. 41.9 %
- Neutral zone time
- 17.5 %25th percentileleague avg. 17.1 %
- Defensive zone time
- 40.8 %35th percentileleague avg. 40.2 %
Shooting
| Shots on goal | Goals | Shooting % | |
|---|---|---|---|
| All | 1637th percentile | 136th percentile | 6.3 %12th percentile |
| High danger | 640th percentile | 152nd percentile | 16.7 %43rd percentile |
| Mid range | 225th percentile | 052nd percentile | 0.0 %28th percentile |
| Long range | 377th percentile | 090th percentile | 0.0 %84th percentile |
Shots on goal by zone
2026-2027 regular season. Measured by puck and player tracking chips; the percentile ranks the player within the league.
Game log, 2026-27
 EDM
 CBJ
 VAN
 COL
 OTT
 DET
 SEA
 CAR
 BOS
Michael Bunting: frequently asked questions
How many goals does Michael Bunting have in 2026-27?
Michael Bunting has 1 goal and 2 points (1 assist) in 12 games in 2026-27.
How old is Michael Bunting?
Michael Bunting is 31 years old: he was born on September 17, 1995.
How tall is Michael Bunting, and how much does he weigh?
Michael Bunting is 6'0" (183 cm) and weighs 185 lb (84 kg).
Where is Michael Bunting from?
Canada: Michael Bunting was born in Scarborough, Ontario, Canada.
What team does Michael Bunting play for?
Michael Bunting plays for the Philadelphia Flyers in the NHL, at L, wearing number 58.
Is Michael Bunting injured?
No: Michael Bunting is not on the latest NHL injury report. This answer is updated throughout the season.
How good is Michael Bunting?
Michael Bunting produced -0.1 wins above replacement (WAR) in 2026-27 (season in progress), 359th of 504 players at his position in the NHL.
Is Michael Bunting a top-10 player at his position?
No: by WAR, he ranks 359th of 504 players at his position in the NHL in 2026-27. Our comparison tool puts him side by side with any other player.
Is Michael Bunting getting better?
No, he is slipping: his PAL rating went from 59 in 2024-25 to 48 in 2025-26 (out of 100, 50 = average player at his position).
How has Michael Bunting played lately?
Over his last 10 games, Michael Bunting has 2 points (1 goal, 1 assist).
What are Michael Bunting's career stats?
Over his NHL career, Michael Bunting has 430 games, 110 goals, 144 assists and 254 points. His best season: 2021-22, with 63 points in 79 games.
Where was Michael Bunting drafted?
Michael Bunting was drafted 117th overall (round 4) by ARI in 2014.
Is Michael Bunting better at home or on the road?
No real difference: in 2026-27, he averages 0.17 points per game at home (1 in 6 games) and 0.17 on the road (1 in 6 games).
How does Michael Bunting perform in the playoffs?
In the playoffs, Michael Bunting has 14 games and 6 points in his career. His pace (0.43 points per game) is lower than his regular-season pace (0.59).
Is Michael Bunting a good fantasy pick?
Probably not, except in deep leagues: our projection has him at 23 points in 2026-27, or 0.37 points per game.
What is Michael Bunting's nationality?
Michael Bunting is Canadian. Internationally: Represented: Team Canada — World Champion, 2021 IIHF World Championship (Canada defeated Finland in the final). Also rejoined the senior national team for the 2024 IIHF World Championship.
What awards has Michael Bunting won?
Named to the AHL All-Star Classic (2019) ; AHL Player of the Week (week ending February 14, 2021) ; Voted to the NHL All-Rookie Team (2021–22).
How many championships has Michael Bunting won?
1: World Champion with Team Canada — 2021 IIHF World Championship.
Where did Michael Bunting play before turning pro?
Played midget hockey with the Don Mills Flyers (GTHL); then selected by the Sault Ste. Marie Greyhounds (OHL), picked 160th in the 2013 OHL Priority Selection; played with the Greyhounds in 2013–14 and 2014–15..
How many points is Michael Bunting projected to score in 2026-27?
Our projection has him at 23 points in 63 games in 2026-27 (8 to 38 points, 80% interval), based on his recent seasons, age and role.
See also: his Philadelphia Flyers teammates
Full roster →

NHL.com ↗ · Stats and photos: NHL (NHL.com)