




Statistiques 2013-14
Canadiens de Montréal
12-5-428 PTS3e dans la division AtlanticLNH
Chances de séries
73 %
Avantage numérique
12.5 %
Infériorité
78.8 %
Buts par match
3.19
Buts alloués
3.05
Mises au jeu
52.6 %
Meneurs du club
Points
 Max Pacioretty60
Buts
Max Pacioretty39Passes
 P.K. Subban43
+/-
 Andrei Markov+12
Points en avantage num.
P.K. Subban23Mises en échec
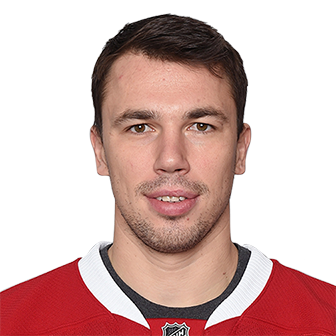 Alexei Emelin189
Victoires
 Carey Price34
% d'arrêts
Carey Price.927- 2. Peter Budaj.909
Joueurs (33)
| Joueur | |||||
|---|---|---|---|---|---|
| Max PaciorettyL | 73 | 39 | 21 | 60 | +8 |
| P.K. SubbanD | 82 | 10 | 43 | 53 | -4 |
| David DesharnaisC | 79 | 16 | 36 | 52 | +11 |
| Andrei MarkovD | 81 | 7 | 36 | 43 | +12 |
| Tomas PlekanecC | 81 | 20 | 23 | 43 | +11 |
| Brendan GallagherR | 81 | 19 | 22 | 41 | +4 |
| Brian GiontaR | 81 | 18 | 22 | 40 | +1 |
| Alex GalchenyukC | 65 | 13 | 18 | 31 | -12 |
| Lars EllerC | 77 | 12 | 14 | 26 | -15 |
| Daniel BrièreC | 69 | 13 | 12 | 25 | +1 |
| Alexei EmelinD | 59 | 3 | 14 | 17 | -1 |
| Rene BourqueR | 63 | 9 | 7 | 16 | -1 |
| Thomas VanekL | 18 | 6 | 9 | 15 | +8 |
| Josh GorgesD | 66 | 1 | 13 | 14 | +6 |
| Michael BournivalL | 60 | 7 | 7 | 14 | -6 |
| Brandon PrustL | 52 | 6 | 7 | 13 | -1 |
| Travis MoenL | 65 | 2 | 10 | 12 | +2 |
| Raphael DiazD | 46 | 0 | 11 | 11 | -4 |
| Mike WeaverD | 17 | 1 | 6 | 7 | +9 |
| Francis BouillonD | 52 | 2 | 4 | 6 | -5 |
| Ryan WhiteC | 52 | 2 | 4 | 6 | -8 |
| Dale WeiseR | 17 | 3 | 1 | 4 | +4 |
| Douglas MurrayD | 53 | 0 | 2 | 2 | -12 |
| Jarred TinordiD | 22 | 0 | 2 | 2 | -2 |
| Nathan BeaulieuD | 17 | 0 | 2 | 2 | +6 |
| George ParrosR | 22 | 0 | 1 | 1 | -6 |
| Martin St. PierreC | 1 | 0 | 0 | 0 | 0 |
| Mike BlundenR | 7 | 0 | 0 | 0 | -2 |
| Louis LeblancC | 8 | 0 | 0 | 0 | +1 |
| Joonas NattinenC | 1 | 0 | 0 | 0 | 0 |
| Gabriel DumontC | 2 | 0 | 0 | 0 | 0 |
| Christian ThomasL | 2 | 0 | 0 | 0 | -1 |
| Patrick HollandR | 5 | 0 | 0 | 0 | 0 |
Statistiques et photos : LNH (NHL.com)