

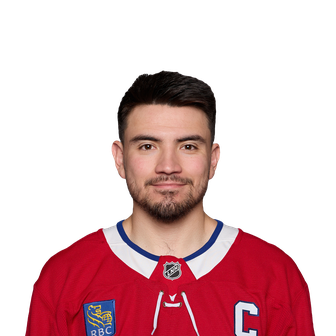
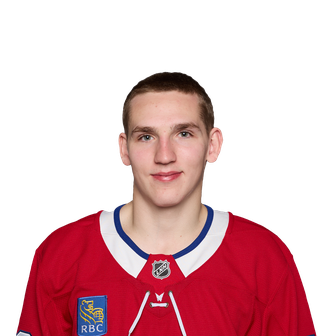

Statistiques 2012-13
Canadiens de Montréal
12-5-428 PTS3e dans la division AtlanticLNH
Chances de séries
73 %
Avantage numérique
12.5 %
Infériorité
78.8 %
Buts par match
3.19
Buts alloués
3.05
Mises au jeu
52.6 %
Meneurs du club
Points
 Max Pacioretty39
Buts
Max Pacioretty15Passes
 P.K. Subban27
+/-
 Alex Galchenyuk+14
Points en avantage num.
P.K. Subban26Mises en échec
 Alexei Emelin110
Victoires
 Carey Price21
% d'arrêts
 Peter Budaj.908
- 2. Carey Price.905
Joueurs (29)
| Joueur | |||||
|---|---|---|---|---|---|
| Max PaciorettyL | 44 | 15 | 24 | 39 | +8 |
| P.K. SubbanD | 42 | 11 | 27 | 38 | +12 |
| Tomas PlekanecC | 47 | 14 | 19 | 33 | +3 |
| Andrei MarkovD | 48 | 10 | 20 | 30 | -9 |
| Lars EllerC | 46 | 8 | 22 | 30 | +8 |
| David DesharnaisC | 48 | 10 | 18 | 28 | -2 |
| Brendan GallagherR | 44 | 15 | 13 | 28 | +10 |
| Alex GalchenyukC | 48 | 9 | 18 | 27 | +14 |
| Brian GiontaR | 48 | 14 | 12 | 26 | +3 |
| Michael RyderR | 27 | 10 | 11 | 21 | -2 |
| Brandon PrustL | 38 | 5 | 9 | 14 | +11 |
| Raphael DiazD | 23 | 1 | 13 | 14 | +4 |
| Rene BourqueR | 27 | 7 | 6 | 13 | -1 |
| Alexei EmelinD | 38 | 3 | 9 | 12 | +2 |
| Francis BouillonD | 48 | 1 | 8 | 9 | +4 |
| Josh GorgesD | 48 | 2 | 7 | 9 | +4 |
| Erik ColeL | 19 | 3 | 3 | 6 | +1 |
| Travis MoenL | 45 | 2 | 4 | 6 | -4 |
| Colby ArmstrongR | 37 | 2 | 3 | 5 | +1 |
| Tomas KaberleD | 10 | 0 | 3 | 3 | +4 |
| Davis DrewiskeD | 9 | 1 | 2 | 3 | 0 |
| Gabriel DumontC | 10 | 1 | 2 | 3 | +1 |
| Jeff HalpernC | 16 | 1 | 1 | 2 | -3 |
| Yannick WeberD | 6 | 0 | 2 | 2 | -1 |
| Jarred TinordiD | 8 | 0 | 2 | 2 | +5 |
| Nathan BeaulieuD | 6 | 0 | 2 | 2 | +5 |
| Ryan WhiteC | 26 | 1 | 0 | 1 | +1 |
| Mike BlundenR | 5 | 0 | 0 | 0 | -1 |
| Greg PaterynD | 3 | 0 | 0 | 0 | 0 |
Statistiques et photos : LNH (NHL.com)