




Stats 1988-89
Washington Capitals
10-9-020 PTS5th in the Metropolitan divisionNHL
Playoff odds
55%
Power play
19.6 %
Penalty kill
75.8 %
Goals per game
3.37
Goals against
3.68
Faceoffs
49.1 %
Team leaders
Points
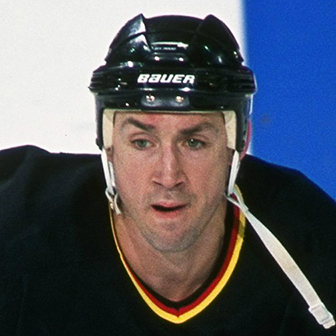 Mike Ridley89
Goals
 Geoff Courtnall42
Assists
 Scott Stevens61
+/-
 Kevin Hatcher+19
Power-play points
Scott Stevens39Wins
 Pete Peeters20
Save %
 Don Beaupre.896
Players (31)
| Player | |||||
|---|---|---|---|---|---|
| Mike RidleyC | 80 | 41 | 48 | 89 | +17 |
| Geoff CourtnallL | 79 | 42 | 38 | 80 | +11 |
| Bengt-Ake GustafssonL | 72 | 18 | 51 | 69 | +13 |
| Scott StevensD | 80 | 7 | 61 | 68 | +1 |
| Dave ChristianR | 80 | 34 | 31 | 65 | +2 |
| Dale HunterC | 80 | 20 | 37 | 57 | -3 |
| Mike GartnerR | 56 | 26 | 29 | 55 | +8 |
| Kevin HatcherD | 62 | 13 | 27 | 40 | +19 |
| Kelly MillerL | 78 | 19 | 21 | 40 | +13 |
| Larry MurphyD | 65 | 7 | 29 | 36 | -5 |
| Stephen LeachR | 74 | 11 | 19 | 30 | -4 |
| Michal PivonkaC | 52 | 8 | 19 | 27 | +9 |
| Rod LangwayD | 76 | 2 | 19 | 21 | +12 |
| Bobby GouldR | 75 | 5 | 13 | 18 | -2 |
| Lou FranceschettiL | 63 | 7 | 10 | 17 | -4 |
| Dino CiccarelliR | 11 | 12 | 3 | 15 | +10 |
| John DruceR | 48 | 8 | 7 | 15 | +7 |
| Grant LedyardD | 61 | 3 | 11 | 14 | +1 |
| Mike MillarR | 18 | 6 | 3 | 9 | -4 |
| Chris FelixD | 21 | 0 | 8 | 8 | +7 |
| Calle JohanssonD | 12 | 1 | 7 | 8 | +1 |
| Neil SheehyD | 72 | 3 | 4 | 7 | -1 |
| Doug WickenheiserC | 16 | 2 | 5 | 7 | 0 |
| Peter SundstromL | 35 | 4 | 2 | 6 | -5 |
| Yvon CorriveauL | 33 | 3 | 2 | 5 | 0 |
| Bill HoulderD | 8 | 0 | 3 | 3 | +7 |
| Bob RouseD | 13 | 0 | 2 | 2 | +2 |
| Jim ThomsonR | 14 | 2 | 0 | 2 | -3 |
| Kent CarlsonD | 2 | 1 | 0 | 1 | +2 |
| Scot KleinendorstC | 3 | 0 | 1 | 1 | 0 |
| Shawn CroninD | 1 | 0 | 0 | 0 | 0 |
Stats and photos: NHL (NHL.com)