


Stats 2010-11
Pittsburgh Penguins
7-11-216 PTS7th in the Metropolitan divisionNHL
Playoff odds
10%
Power play
20.0 %
Penalty kill
79.6 %
Goals per game
3.00
Goals against
3.50
Faceoffs
46.5 %
Team leaders
Points
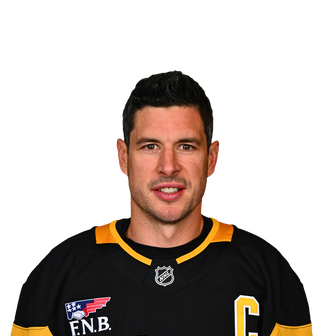
 Sidney Crosby66
Goals
Sidney Crosby32Assists
 Kris Letang42
+/-
 Alex Goligoski+20
Power-play points
Kris Letang24Hits
 Brooks Orpik194
Wins
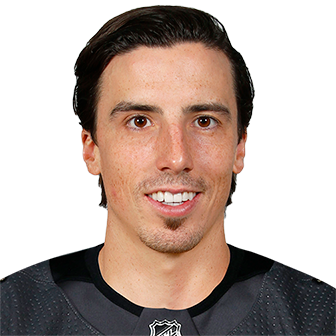 Marc-Andre Fleury36
Save %
 Brent Johnson.922
Players (35)
| Player | |||||
|---|---|---|---|---|---|
| Sidney CrosbyC | 41 | 32 | 34 | 66 | +20 |
| Kris LetangD | 82 | 8 | 42 | 50 | +15 |
| Chris KunitzL | 66 | 23 | 25 | 48 | +18 |
| Tyler KennedyC | 80 | 21 | 24 | 45 | +1 |
| Pascal DupuisR | 81 | 17 | 20 | 37 | +16 |
| Evgeni MalkinC | 43 | 15 | 22 | 37 | -4 |
| Alex GoligoskiD | 60 | 9 | 22 | 31 | +20 |
| Matt CookeL | 67 | 12 | 18 | 30 | +14 |
| Jordan StaalC | 42 | 11 | 19 | 30 | +7 |
| Mark LetestuC | 64 | 14 | 13 | 27 | +4 |
| Paul MartinD | 77 | 3 | 21 | 24 | +9 |
| Max TalbotC | 82 | 8 | 13 | 21 | -3 |
| Zbynek MichalekD | 73 | 5 | 14 | 19 | 0 |
| Mike RuppL | 81 | 9 | 8 | 17 | -4 |
| Ben LovejoyD | 47 | 3 | 14 | 17 | +11 |
| Chris ConnerR | 60 | 7 | 9 | 16 | +5 |
| Craig AdamsR | 80 | 4 | 11 | 15 | -5 |
| Brooks OrpikD | 63 | 1 | 12 | 13 | +12 |
| Dustin JeffreyL | 25 | 7 | 5 | 12 | +5 |
| Arron AshamR | 44 | 5 | 6 | 11 | 0 |
| Deryk EngellandD | 63 | 3 | 7 | 10 | -5 |
| Alex KovalevR | 20 | 2 | 5 | 7 | +3 |
| Mike ComrieC | 21 | 1 | 5 | 6 | -4 |
| James NealL | 20 | 1 | 5 | 6 | -1 |
| Brett SterlingL | 7 | 3 | 2 | 5 | +1 |
| Matt NiskanenD | 18 | 1 | 3 | 4 | -2 |
| Eric GodardR | 19 | 0 | 3 | 3 | +4 |
| Nick JohnsonR | 4 | 1 | 2 | 3 | +1 |
| Eric TangradiL | 15 | 1 | 2 | 3 | -4 |
| Joe VitaleC | 9 | 1 | 1 | 2 | -1 |
| Andrew HutchinsonD | 5 | 0 | 1 | 1 | -3 |
| Ryan CraigC | 6 | 0 | 0 | 0 | -3 |
| Corey PotterD | 1 | 0 | 0 | 0 | 0 |
| Brian StraitD | 3 | 0 | 0 | 0 | -1 |
| Tim WallaceR | 7 | 0 | 0 | 0 | -3 |
Stats and photos: NHL (NHL.com)