


Ty
Dellandrea
C · SJS · Limited · Very poor
- PAL
- 7
- WAR
- -0.8
- Value
- 14
- PTS
- 11
2025-26№ 592 / 615
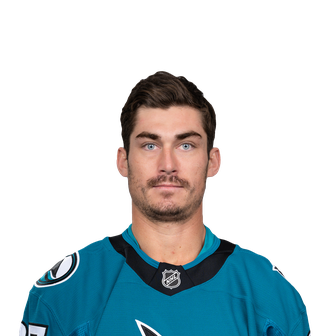
Ty Dellandrea (San Jose Sharks) stats and profile: offensive production, ice time, advanced stats, WAR and PAL rating.
Ty Dellandrea
#10CPlays: Centre · 89% of faceoffs San Jose Sharks
HEIGHT : 188 cm · WEIGHT : 86 kg · SHOOTS : R
Born : July 20, 2000 · Port Perry, Canada
Drafted : 2018 · DAL · round 1, pick #13
Contract : $1,625,000 · 2026-27 → 2027-28 · Standard Contract (Extension) · UFA
NHL record
| Year | Team | GP | G | A | PTS | PIM |
|---|---|---|---|---|---|---|
| 2026-27 | San Jose Sharks | 11 | 0 | 1 | 1 | 10 |
| 2025-26 | San Jose Sharks | 46 | 2 | 9 | 11 | 22 |
| 2024-25 | San Jose Sharks | 68 | 1 | 7 | 8 | 59 |
| 2023-24 | Dallas Stars | 42 | 2 | 7 | 9 | 23 |
| 2022-23 | Dallas Stars | 82 | 9 | 19 | 28 | 54 |
| 2021-22 | Dallas Stars | 1 | 0 | 0 | 0 | 0 |
| 2020-21 | Dallas Stars | 26 | 3 | 2 | 5 | 23 |
| NHL totals | 276 | 17 | 45 | 62 | 191 | |
Playoffs
| Year | Team | GP | G | A | PTS | PIM |
|---|---|---|---|---|---|---|
| 2023-24 | Dallas Stars | 6 | 1 | 0 | 1 | 2 |
| 2022-23 | Dallas Stars | 15 | 3 | 0 | 3 | 22 |
| 2021-22 | Dallas Stars | 1 | 0 | 0 | 0 | 0 |
| Playoff totals | 22 | 4 | 0 | 4 | 24 | |
Ty Dellandrea: our analysis
2025-26 season: 46 GP, 2 G, 9 A, 11 PTS, -18 +/-, 14:11 TOI. WAR -0.8 (592nd of 615) · PAL 7, very poor.
In 2025-26, Ty Dellandrea, 26, posts a PAL Rating of 7 out of 100 (very poor), and his WAR of -0.8 ranks 592nd among 615 regulars, in the bottom quarter.
His strengths: discipline (90, among the best in the league) and penalty kill (88, among the best in the league). On the other hand, possession (1, among the weakest in the league) and shooting (13, among the weakest in the league) hold him back.
Breaking down his WAR (goals above average), his biggest contribution: penalties (+1.0); his biggest cost: finishing (-4.5).
An improvement on 2024-25, when his PAL was 4; his WAR went from -1.2 to -0.8.
Contract-wise, his Value score of 14 (very poor return) weighs his output against what he costs: 50 is what that salary should buy.
Ty Dellandrea's story
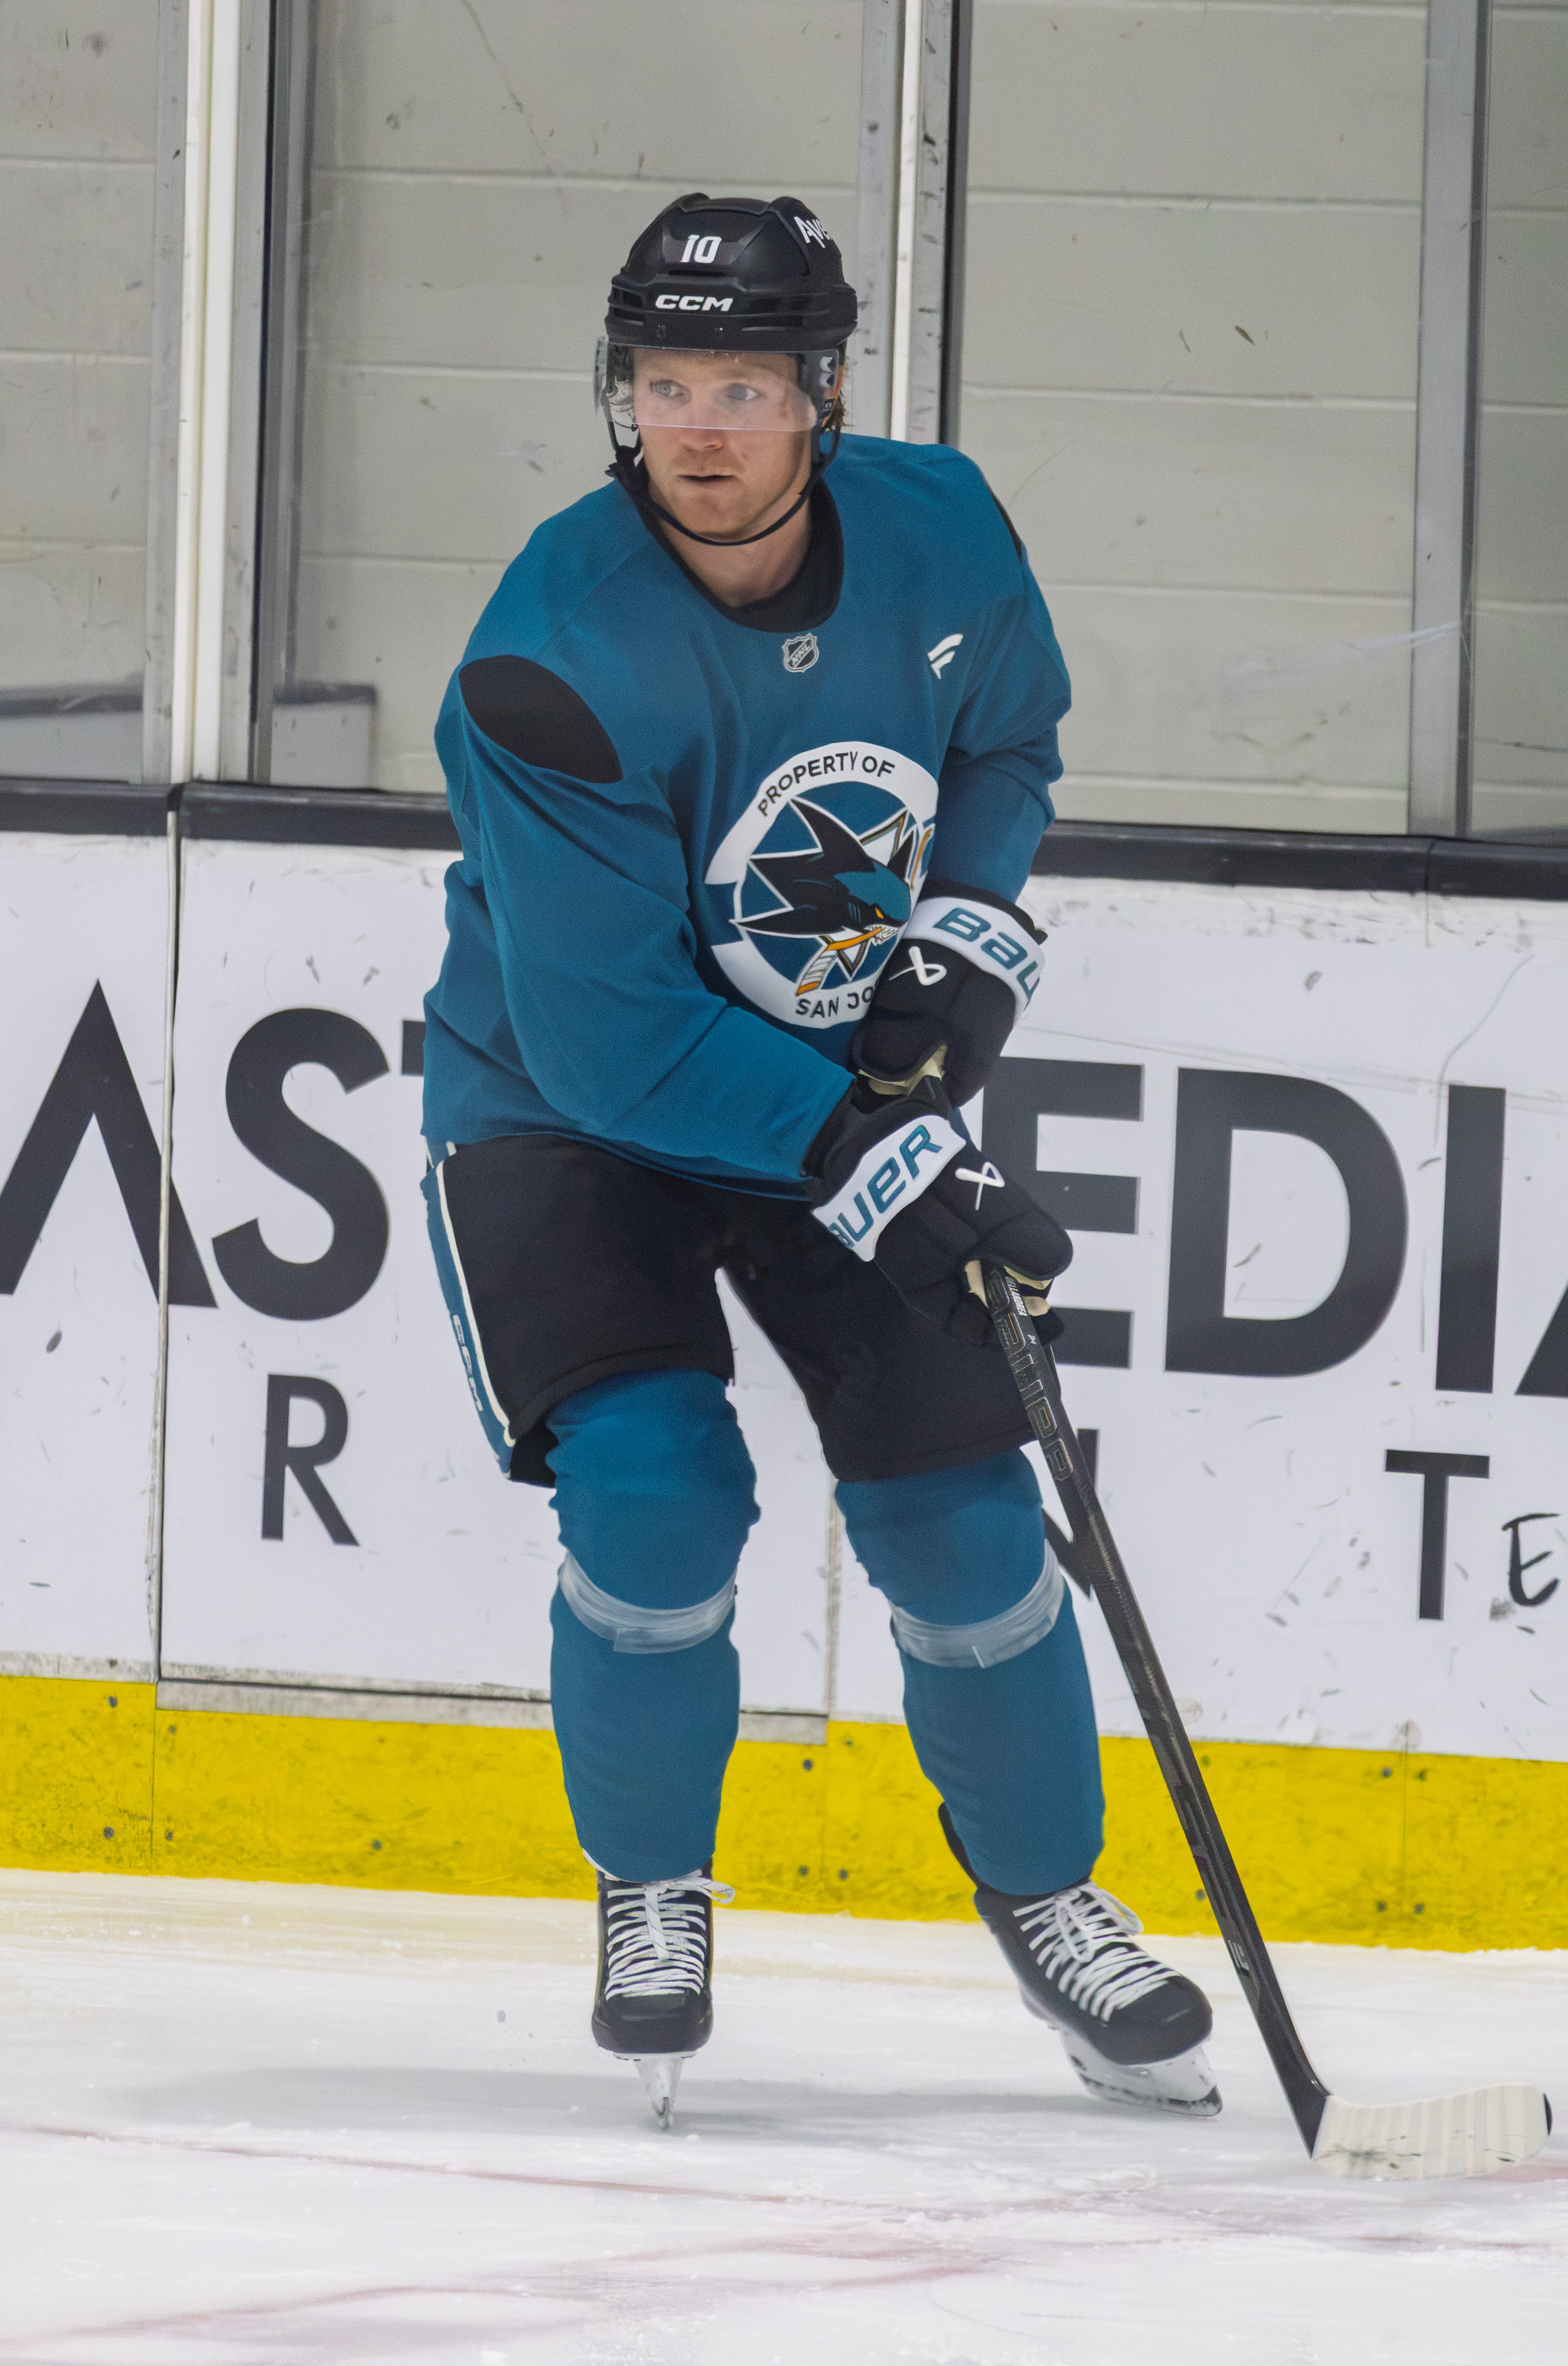
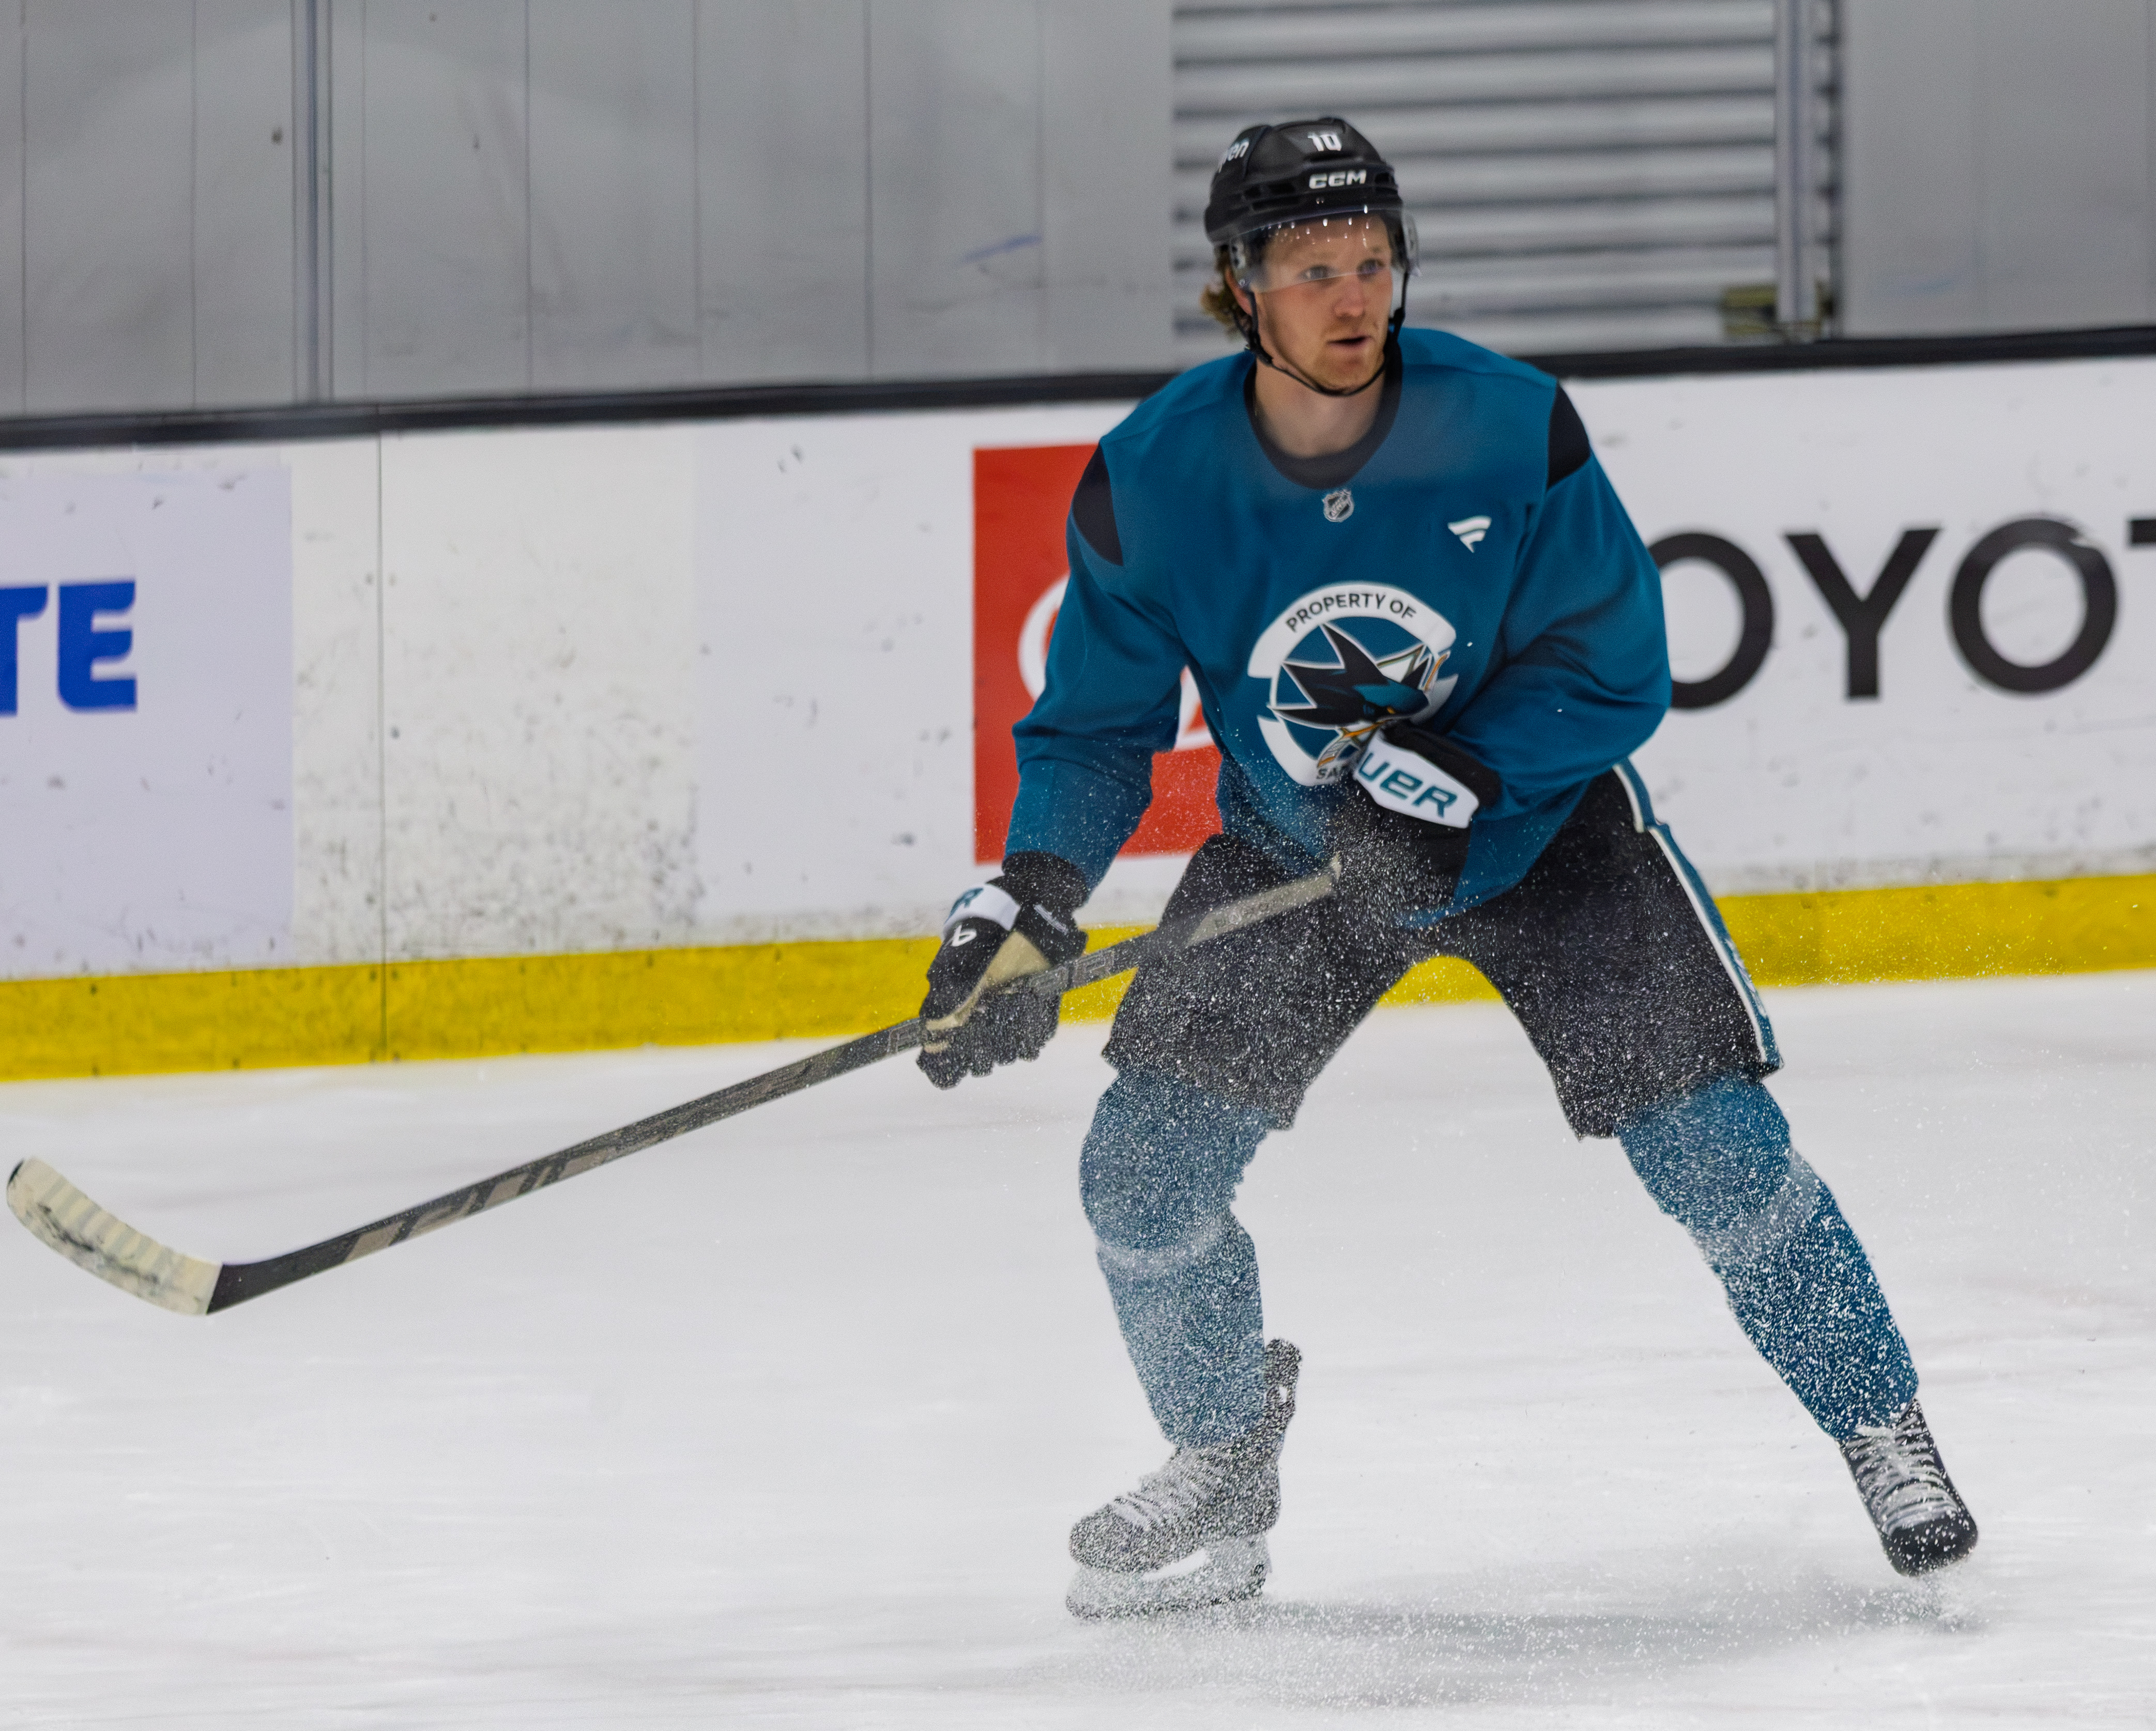
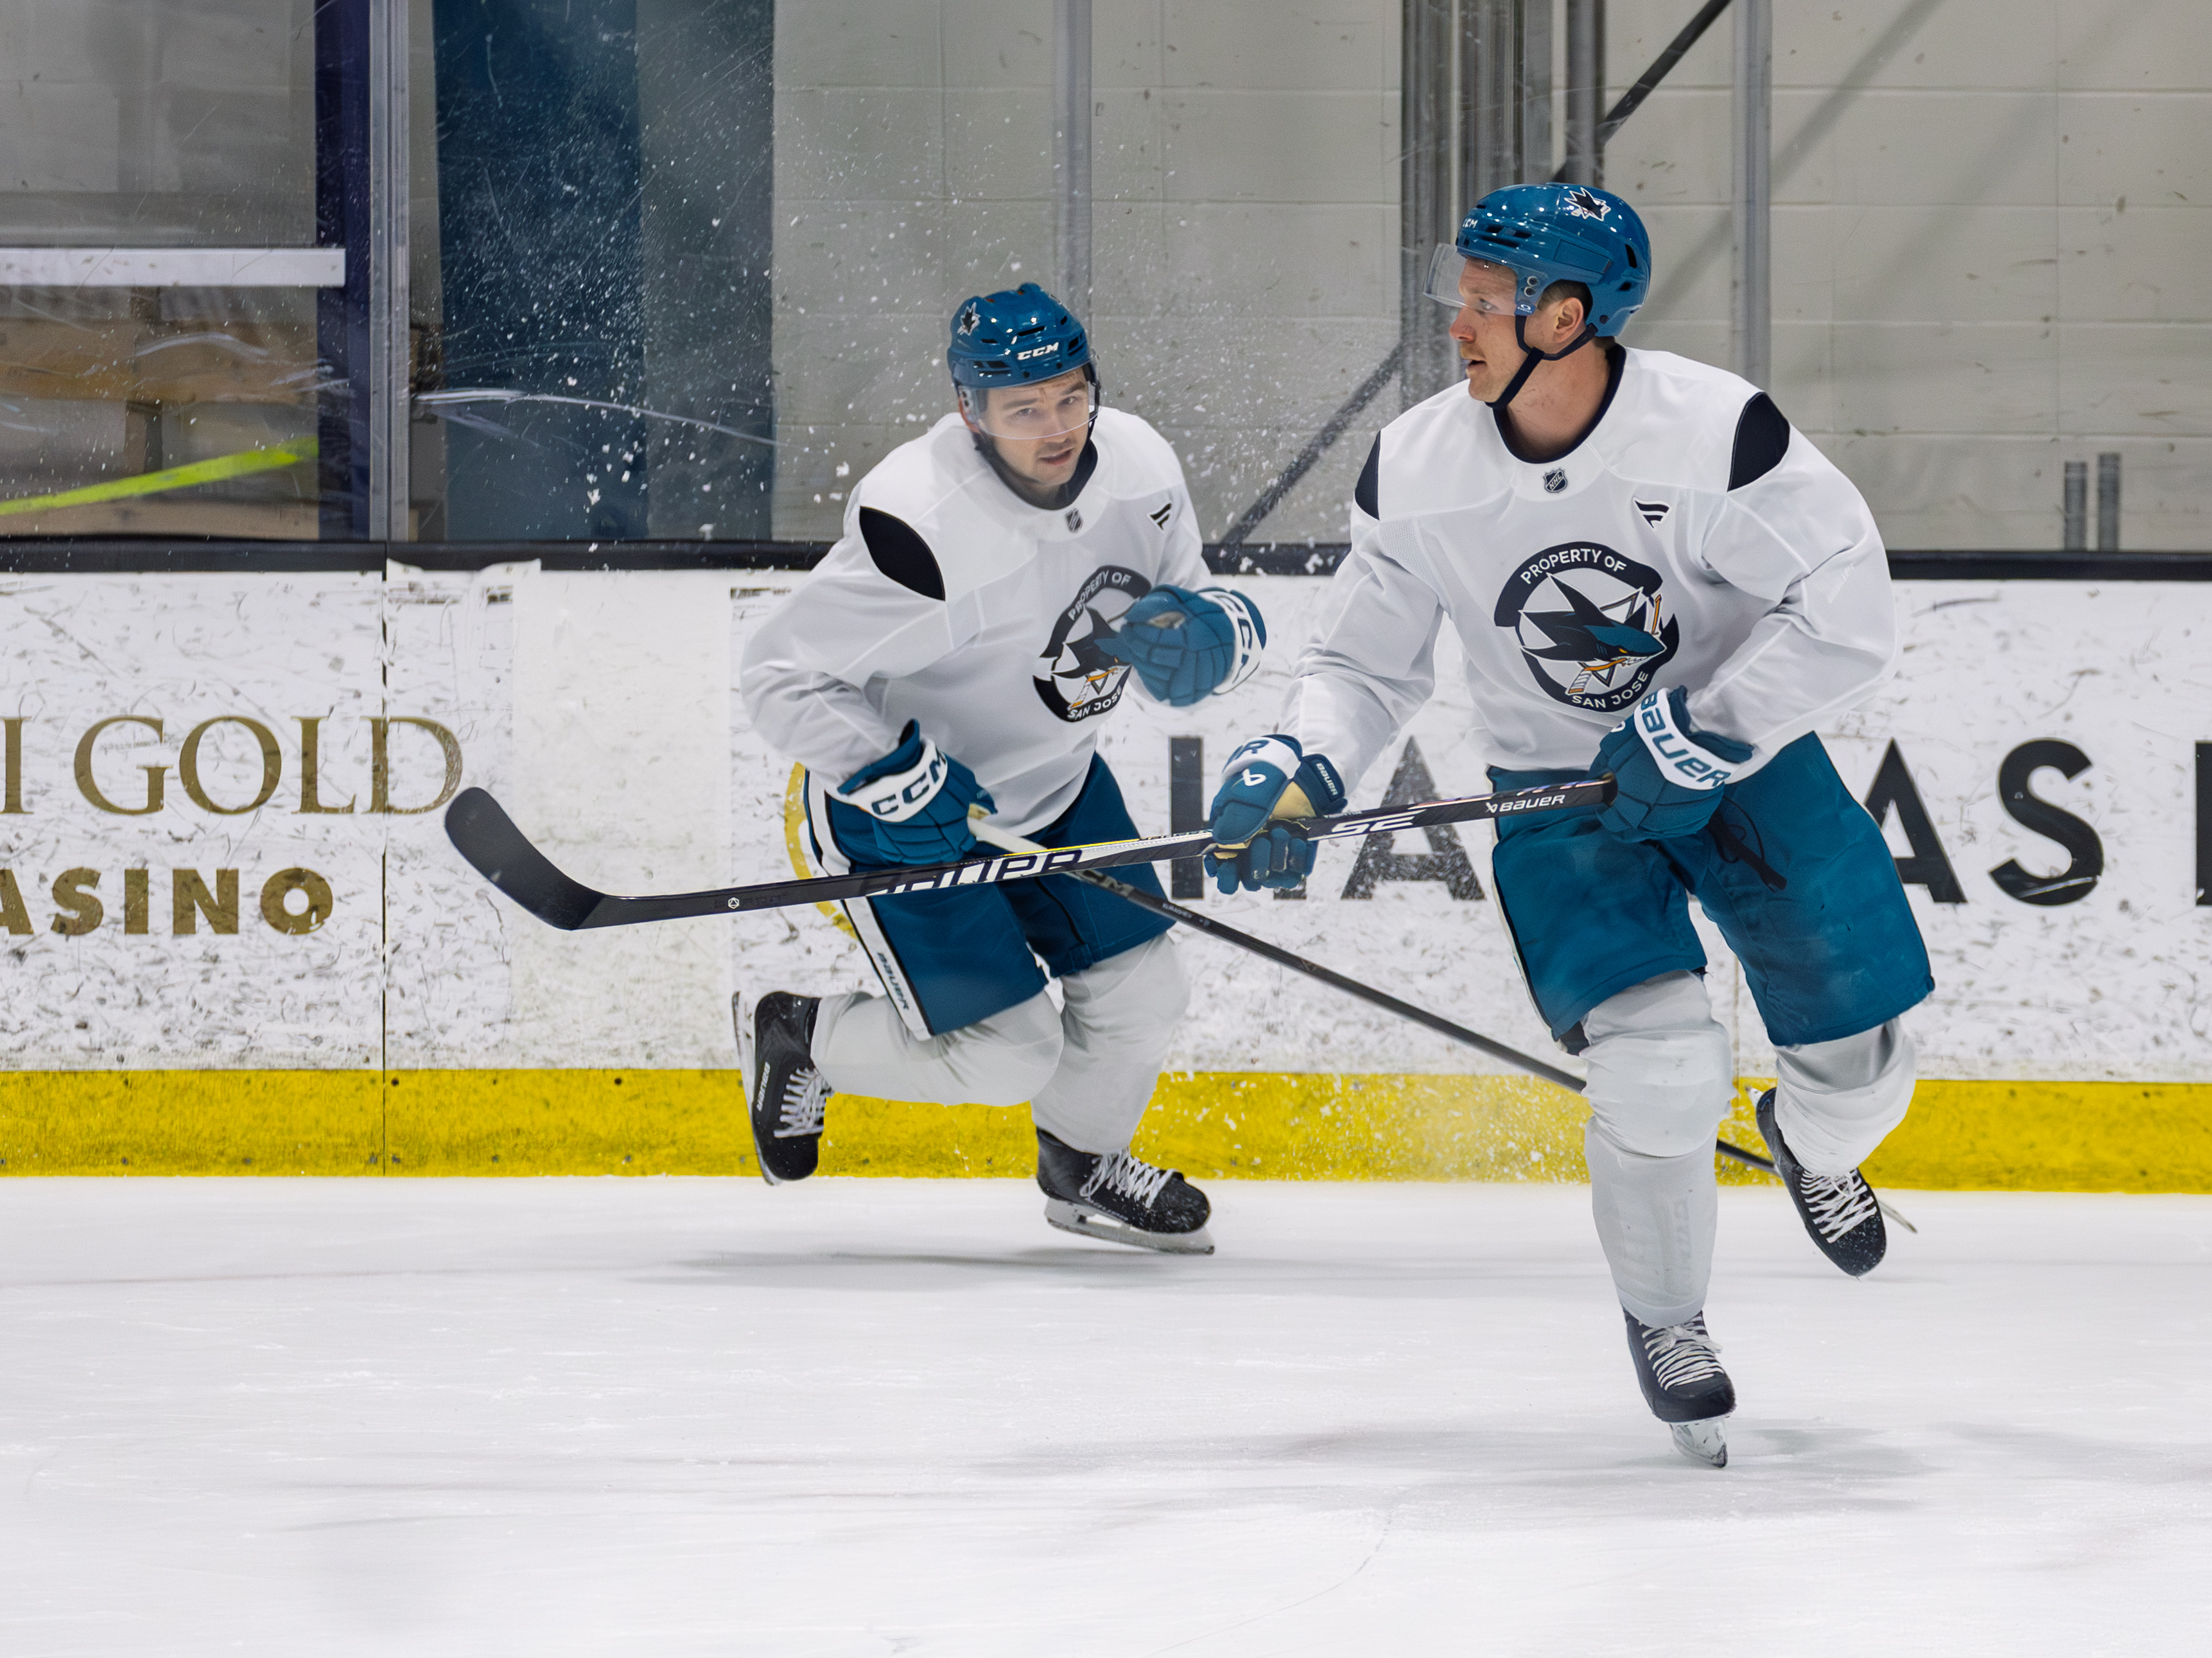
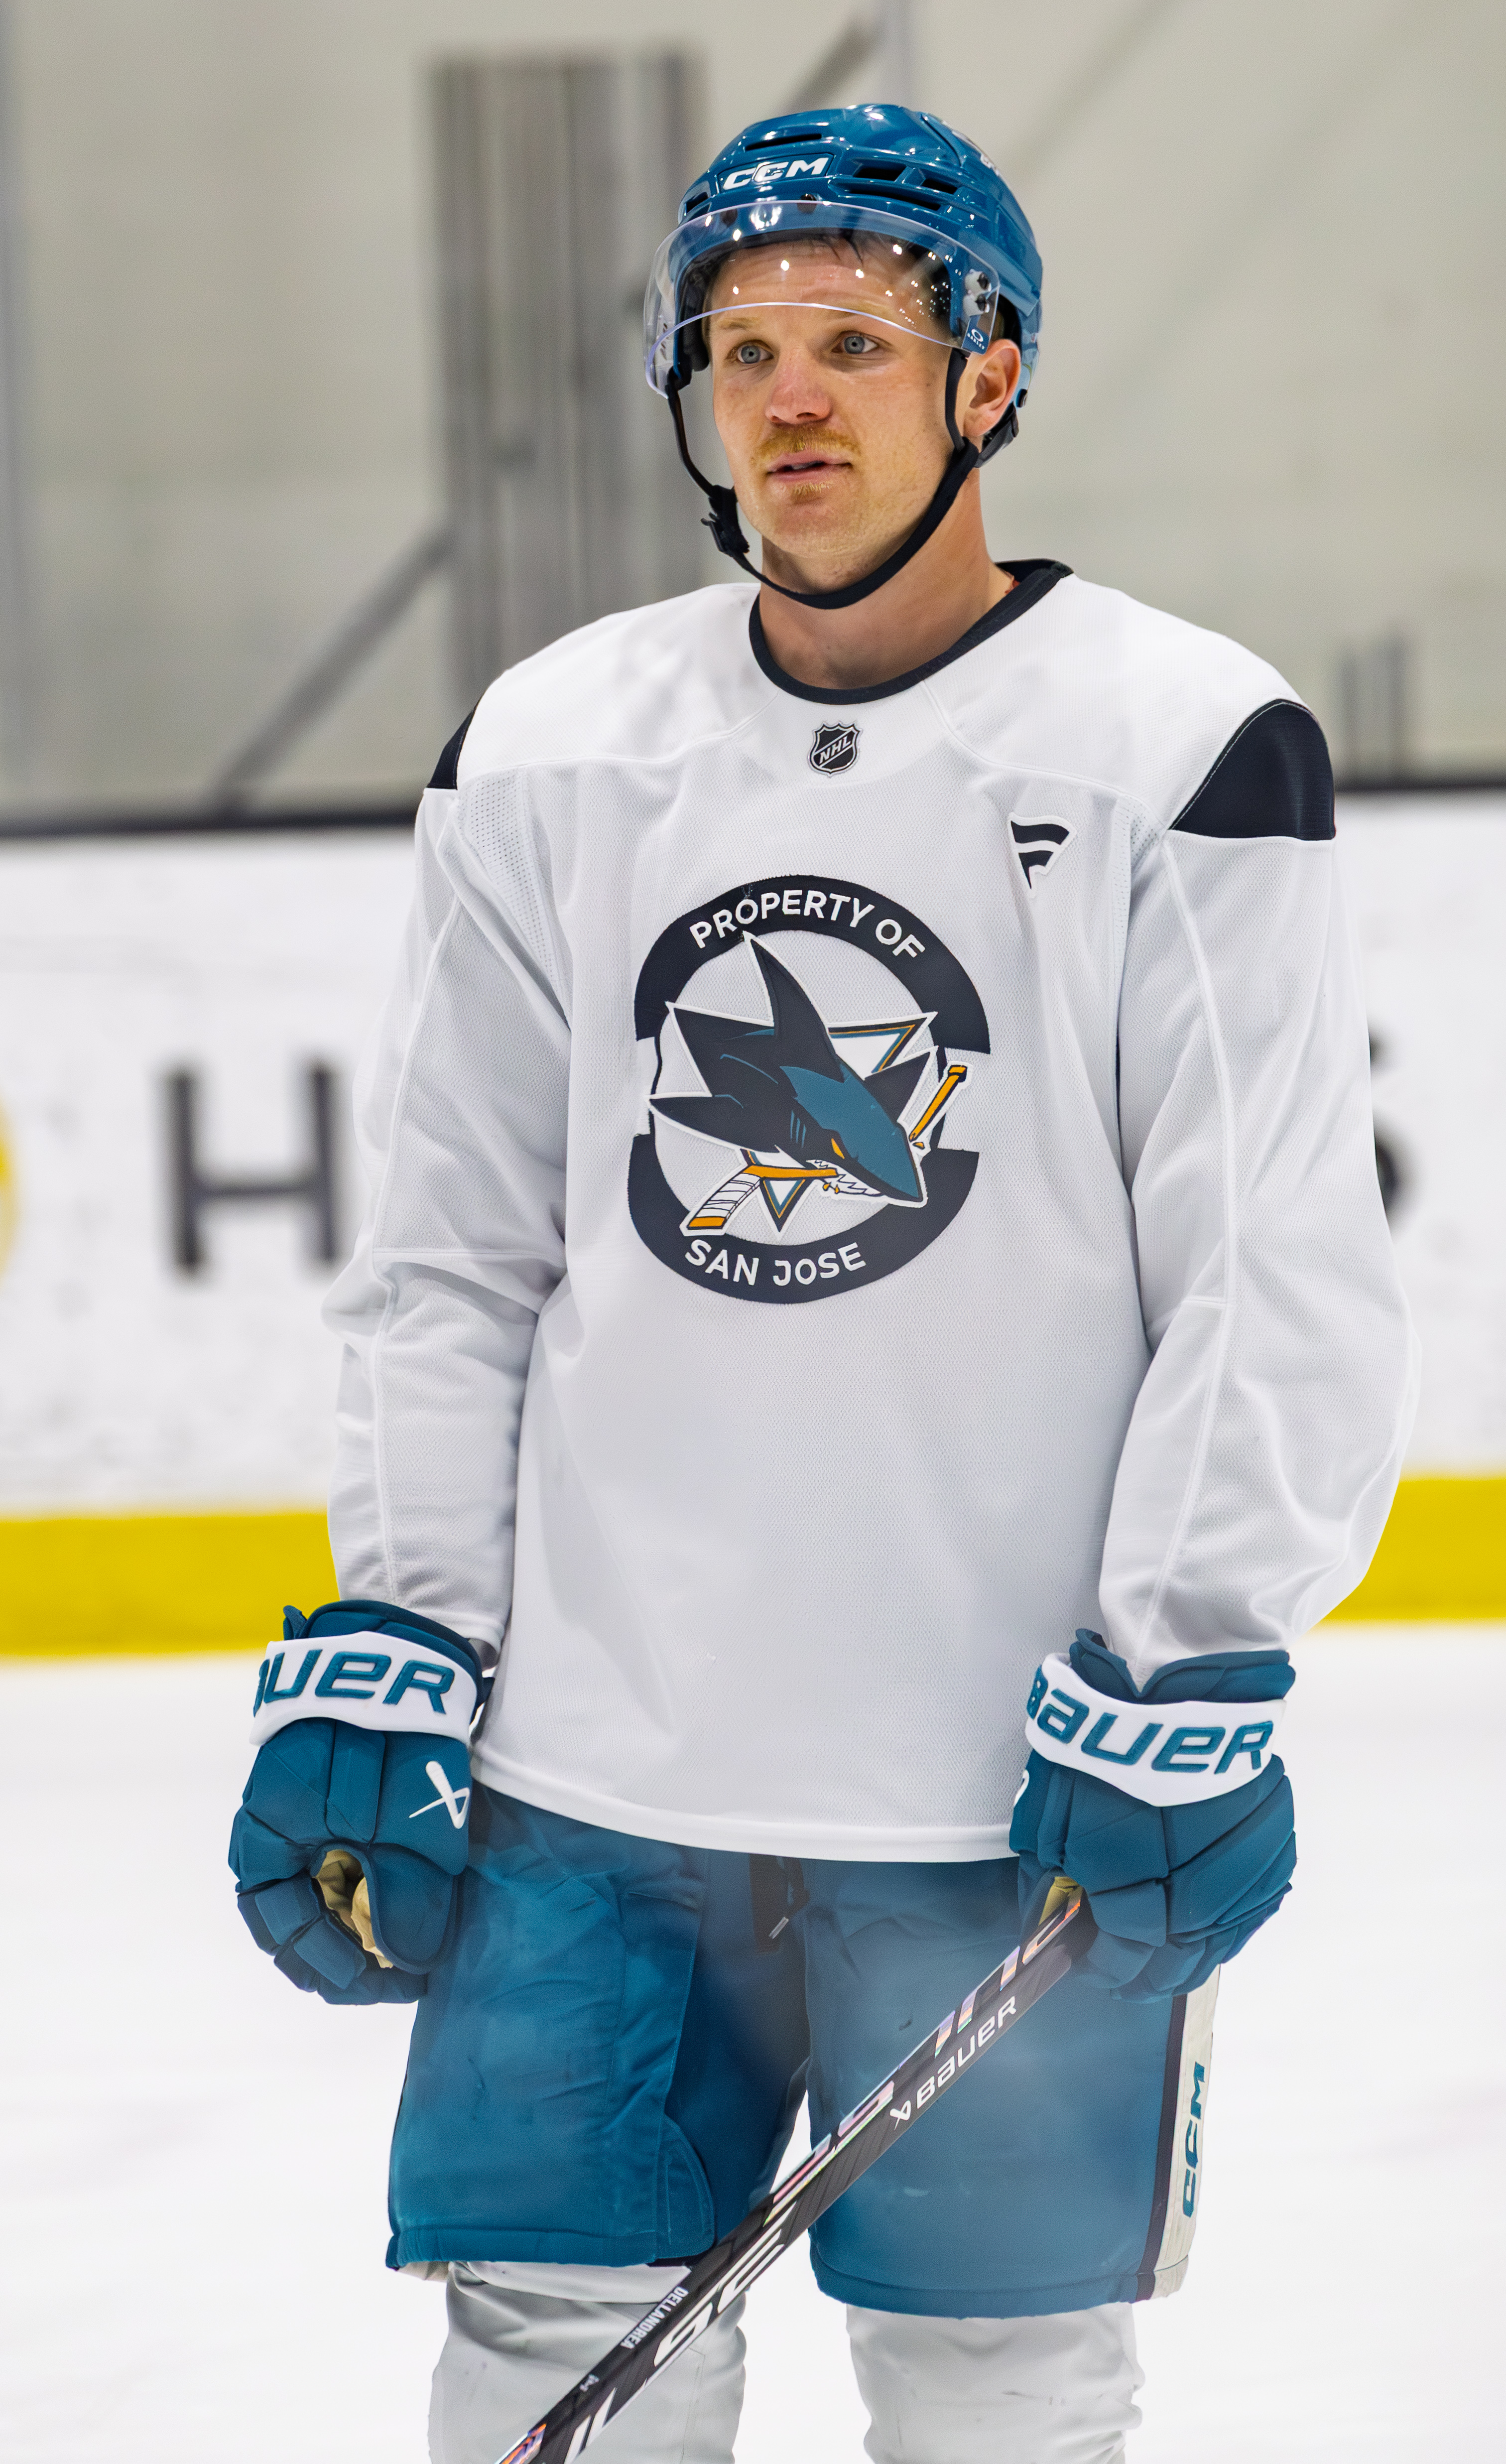
When he was seven Ty Dellandrea moved to Port Perry and joined the Central Ontario Wolves, a step that helped him settle in and develop his hockey skills. He rose through the Ontario junior ranks after being taken fifth overall by the Flint Firebirds in the 2016 OHL Priority Selection. Early on he chose number 53 as a personal tribute, and he combined steady on-ice improvement with strong academics, earning a 4.0 GPA at Grand Blanc High School and the Combined Academic & Athletics Excellence award.
Dellandrea’s Flint tenure charted a clear upward arc: 13 goals and 24 points in 2016–17, then 27 goals and 59 points in 2017–18 when he was named team MVP. He was named captain for 2018–19 and posted 22 goals and 63 points. In 2019–20 he recorded a career-high 32 goals and 70 points in 48 games and received recognition for his leadership with the Mickey-Renaud Trophy. Several multi-point games, two hat-tricks and streaks of consecutive productive outings marked his final junior seasons.
Selected 13th overall by the Dallas Stars in the 2018 NHL Draft, Dellandrea signed a three-year entry-level contract on 19 September 2018. After his junior season he joined the AHL’s Texas Stars in March 2019, making his professional debut on 20 March and scoring his first pro goal — a game-winning penalty shot — on 5 April while also recording an assist that night. He made his NHL debut on 22 January 2021 and appeared in 26 games in the pandemic-shortened 2020–21 campaign, posting three goals and two assists.
Dellandrea spent seven seasons in the Stars organization before being traded to the San Jose Sharks on 19 June 2024 for a 2025 fourth-round pick. He signed a two-year deal in July 2024 and agreed to a two-year extension on 13 March 2026. In 2025–26 he recorded 2 goals and 9 assists in 42 games and, prior to a lower-body injury in January 2026, was winning 52.3% of his faceoffs.
Internationally he served as an assistant captain for Canada at the 2018 IIHF U18s, finishing with 2 goals and 5 points, and was part of Canada’s gold-medal squad at the 2020 World Junior Championship, contributing 3 goals and 5 points. His game is grounded in responsible two-way play, faceoff strength and the ability to chip in offensively in key situations.
Facts drawn from Wikipédia, told in our own words.
Advanced stats
- TOI/GP
- 12:55
- PP TOI/GP
- 0:03
- SH TOI/GP
- 1:43
- Pts/GP
- 0.09
- EV points
- 0
- Hits
- 35
- Blocks
- 8
- Takeaways
- 1
- Corsi % (SAT)
- 40.1 %
- Off. zone starts
- 20.6 %
- Faceoffs
- 51.5 %
Stats and photos: NHL (NHL.com)
2026-27 projection
Projected points
10between 1 and 20 (80% range)
- Goals
- 2
- Assists
- 8
- Games
- 53
So far: 1 pts in 11 games. The team has played 19 of 84 games. Projected pace: 0.22 pts per game (last season: 0.24).
The projection follows last season's pace. Tested on 2,265 player seasons (2022-23 to 2025-26): average miss of 9 points over 82 games; for players at 0.9 points per game and up, it ran 5 points high on average.
Trend
Stable
- Points per game: 0.21 in 23-24, 0.24 in 25-26
- PAL Rating: 4 → 7
Outlook, age included
→ StableAge 26: prime years
This is only a projection. It knows nothing about injuries, trades or role changes; one player in five finishes outside the range.
Player ratings, 2025-26
All ratings →Fourteen ratings from 0 to 100 drawn from data, never by hand: 75 = established NHL player, 95+ = elite.
OV · OverallConfidence 75 %
58
Replacement or prospect
- SK
- Skating
- 77
- Confidence 73 %
- ST
- Strength
- 82
- Confidence 79 %
- EN
- Endurance
- 67
- Confidence 80 %
- DU
- Durability
- 63
- Confidence 77 %
- CK
- Checking
- 87
- Confidence 79 %
- FG
- Fighting
- 85
- Confidence 59 %
- DI
- Discipline
- 73
- Confidence 79 %
- FO
- Faceoffs
- 78
- Confidence 77 %
- PA
- Passing
- 60
- Confidence 75 %
- SC
- Scoring
- 55
- Confidence 75 %
- DF
- Defense
- 74
- Confidence 72 %
- PS
- Penalty shot
- 64
- Confidence 8 %
- EX
- Experience
- 73
- Confidence 100 %
Why these ratings?Hide details
SK — Skating77
- Top speed (35 %)36.1 · 74
- Bursts > 20 mph /60 (30 %)8.014 · 82
- Distance /60 (20 %)16.3 · 75
- Speed consistency (15 %)35.3 · 73
ST — Strength82
- Contact absorbed /60 (50 %)5.651 · 88
- Body mass (50 %)-0.526 · 72
EN — Endurance67
- Ice time per game (45 %)13.6 · 68
- Total ice time (20 %)639 · 62
- Shift length (15 %)44.1 · 70
- Lowest recent ice time per game (15 %)12.1 · 67
- Special-teams time per game (5 %)2.164 · 72
DU — Durability63
- Share of games played (100 %)0.717 · 63
CK — Checking87
- Hits /60 (70 %)8.909 · 88
- Lowest seasonal rate (20 %)6.053 · 85
- Season volume (10 %)4.875 · 84
FG — Fighting85
- Fights per 82 games (100 %)1.255 · 85
DI — Discipline73
- Net penalty value /60 (50 %)0.021 · 77
- Penalties taken /60 (30 %)1.015 · 57
- Penalties drawn /60 (20 %)1.143 · 91
FO — Faceoffs78
- Faceoff % (85 %)50.7 · 78
- Faceoffs /60 (15 %)36.5 · 73
PA — Passing60
- Primary assists /60 (40 %)0.588 · 70
- Secondary assists /60 (20 %)0.346 · 63
- Offensive creation (RAPM) (20 %)-0.147 · 54
- Power-play points /60 (10 %)4.482 · 75
- Assist consistency (10 %)0.293 · 64
SC — Scoring55
- Goals /60 (25 %)0.411 · 37
- Individual xG /60 (20 %)0.651 · 63
- Finishing (goals − xG per shot) (20 %)-1.232 · 50
- High-danger chances /60 (15 %)1.329 · 77
- xG per shot (10 %)0.083 · 77
- Shot attempts /60 (10 %)10.2 · 61
DF — Defense74
- RAPM defense /60 (35 %)0.048 · 79
- Relative xG against (20 %)0.056 · 69
- On-ice xG against /60 (15 %)2.731 · 68
- Penalty kill /60 (10 %)0.014 · 81
- Takeaways − giveaways /60 (10 %)-1.278 · 77
- Shot attempts against /60 (5 %)60.7 · 61
- Blocked shots /60 (5 %)3.284 · 85
PS — Penalty shot64
- Shootouts (60 %)32.7 · 76
- Penalty shots (40 %)25.4 · 57
EX — Experience73
- Career regular-season games (65 %)79
- Career playoff games (25 %)59
- NHL seasons (10 %)66
OV — Overall58
- SC · Scoring (20 %)55
- PA · Passing (20 %)60
- DF · Defense (20 %)74
- SK · Skating (12 %)77
- FO · Faceoffs (10 %)78
- EN · Endurance (8 %)67
- DI · Discipline (5 %)73
- ST · Strength (3 %)82
- CK · Checking (2 %)87
| Season | OV | SK | SC | DF |
|---|---|---|---|---|
| 2025-26 | 58 | 77 | 55 | 74 |
| 2024-25 | 51 | 71 | 47 | 79 |
| 2023-24 | 65 | 66 | 57 | 84 |
| 2022-23 | 68 | 65 | 59 | 82 |
The bars show confidence (sample size), not player quality. — : not enough data, not a zero. Engine version 1.0.
WAR and PAL ratings, 2025-26
How we rate →PAL Rating scores performance from 0 to 100 against players at the same position (50 = average player), starting from the player's strength, offensive or defensive. Value Rating compares that performance with what the player costs: 50 means paid what the play is worth.
WAR
-0.8
wins above replacement
592 of 615
PAL Rating
7/ 100
Performance · Very poor
443 of 476 at the position
Value Rating
14/ 100
Very poor return
1.30 M$ · expected PAL 41
ProfileLimitedBelow average at both ends
- Offense
- 4
- Defense
- 23
See full detailsHide details
- Offense
- 14
- Creation
- 22
- Shooting
- 13
- Possession
- 1
- Defense
- 35
- Discipline
- 90
- Power play
- 21
- Penalty kill
- 88
From 0 to 100; 50 is the average player at the same position, adjusted for ice time.
| Season | Team | WAR | PAL | Value | Cap hit |
|---|---|---|---|---|---|
| 2025-26 | SJS | -0.8 | 7 | 14 | 1.30 M$ |
| 2024-25 | SJS | -1.2 | 4 | 6 | 1.30 M$ |
| 2023-24 | DAL | -0.4 | 49 | 62 | 0.90 M$ |
| 2022-23 | DAL | 0.2 | 48 | 63 | 0.86 M$ |
Hockey IQ, 2025-26
Rankings and method →The quality of the player's decisions with and against the puck at 5-on-5, against regulars at the same position (50 = average). PAL measures output; IQ measures how the player plays.
Overall IQ
61/ 100
Average
better than 61% of forwards, offense and defense combined
Offensive IQ
96/ 100
Elite
passing, shots, puck
Defensive IQ
11/ 100
Low
takeaways, discipline, own zone
Overall IQ isn't an average of the two scores: it's the player's rank with offense and defense combined, 164 of 424 forwards.
See full detailsHide details
Offense
- Playmaking passes
- 74
- Shot selection
- 80
- Penalties drawn
- 98
- Puck management
- 37
Defense
- Takeaways
- 25
- Discipline
- 15
- Safe zone exits
- 38
Percentiles: 80 means better than 80% of regulars at the same position. Play without the puck (positioning, coverage) isn't measured: the NHL doesn't publish that data.
| Season | Team | IQ | Off. | Def. |
|---|---|---|---|---|
| 2025-26 | SJS | 61 | 96 | 11 |
| 2024-25 | SJS | 2 | 25 | 1 |
| 2023-24 | DAL | 20 | 63 | 11 |
| 2022-23 | DAL | 17 | 65 | 8 |
WAR, 2025-26
How it's calculated →Wins added to the team, compared with a replacement-level player called up from the AHL.
-0.8
wins above replacement
-1.5 to -0.4 — 90% interval
592 of 615 forwards
-4.3 goals above replacement
Full leaderboard →See full detailsHide details
- EV offense
- -2.5
- EV defense
- +0.1
- Power play
- -0.0
- Penalty kill
- -0.0
- Shooting
- -4.5
- Penalties
- +1.0
- Average → replacement
- +1.7
In goals.
| Season | Team | GP | WAR | 90% interval | Rank |
|---|---|---|---|---|---|
| 2025-26 | SJS | 47 | -0.8 | -1.5 to -0.4 | 592/615 |
| 2024-25 | SJS | 64 | -1.2 | -1.9 to -0.6 | 592/596 |
| 2023-24 | DAL | 42 | -0.4 | -0.8 to 0.1 | 535/608 |
| 2022-23 | DAL | 82 | 0.2 | -1.0 to 1.4 | 283/617 |
Player tracking (NHL EDGE)
League EDGE leaderboards →Speed, shot power, distance covered, time by zone: measured by chips in the puck and shoulder pads. 90th percentile = better than 90% of players.
- Hardest shot
- 136.6 km/h65th percentileleague avg. 130.1 km/h
- Top skating speed
- 35.6 km/h62nd percentileleague avg. 35.2 km/h
- Bursts over 20 mph, season
- 2260th percentileleague avg. 21
- Offensive zone time
- 34.3 %1st percentileleague avg. 43.0 %
See full detailsHide details
- Total distance, season
- 36.6 km30th percentileleague avg. 53.1 km
- Distance, single-game high
- 4.05 km34th percentileleague avg. 4.52 km
- Offensive zone at 5v5
- 36.4 %2nd percentileleague avg. 41.4 %
- Neutral zone time
- 18.1 %49th percentileleague avg. 18.7 %
- Defensive zone time
- 47.6 %2nd percentileleague avg. 38.3 %
Shooting
| Shots on goal | Goals | Shooting % | |
|---|---|---|---|
| All | 1027th percentile | 024th percentile | 0.0 %3rd percentile |
| High danger | 433rd percentile | 033rd percentile | 0.0 %10th percentile |
| Mid range | 334th percentile | 054th percentile | 0.0 %32nd percentile |
| Long range | 153rd percentile | 092nd percentile | 0.0 %86th percentile |
Shots on goal by zone
2026-2027 regular season. Measured by puck and player tracking chips; the percentile ranks the player within the league.
Game log, 2026-27
 DAL
 MIN
 LAK
 OTT
 VAN
 BUF
 BOS
 MTL
 STL
Ty Dellandrea: frequently asked questions
How many goals does Ty Dellandrea have in 2026-27?
Ty Dellandrea has 0 goals and 1 point (1 assist) in 11 games in 2026-27.
How old is Ty Dellandrea?
Ty Dellandrea is 26 years old: he was born on July 21, 2000.
How tall is Ty Dellandrea, and how much does he weigh?
Ty Dellandrea is 6'2" (188 cm) and weighs 190 lb (86 kg).
Where is Ty Dellandrea from?
Canada: Ty Dellandrea was born in Port Perry, Ontario, Canada.
What team does Ty Dellandrea play for?
Ty Dellandrea plays for the San Jose Sharks in the NHL, at C, wearing number 10.
Is Ty Dellandrea injured?
No: Ty Dellandrea is not on the latest NHL injury report. This answer is updated throughout the season.
How good is Ty Dellandrea?
Ty Dellandrea produced -0.8 wins above replacement (WAR) in 2025-26, 592nd of 615 players at his position in the NHL. His PAL rating is 7 out of 100: very poor for his position.
How much does Ty Dellandrea make?
Ty Dellandrea earns $1.3M for the 2025-26 season. His Value Rating is 14 out of 100 (very poor return): it measures the on-field return for that salary, compared with players at his position.
When does Ty Dellandrea's contract end?
Ty Dellandrea's contract runs through the 2027-28 season; he will then be an unrestricted free agent.
Is Ty Dellandrea overpaid?
Yes, his output falls short of what his salary should buy. His Value rating is 14 out of 100 (very poor return), where 50 is the output expected for his salary, compared with players at his position.
Is Ty Dellandrea a top-10 player at his position?
No: by WAR, he ranks 592nd of 615 players at his position in the NHL in 2025-26. Our comparison tool puts him side by side with any other player.
Is Ty Dellandrea getting better?
Yes: his PAL rating went from 4 in 2024-25 to 7 in 2025-26 (out of 100, 50 = average player at his position).
How has Ty Dellandrea played lately?
Over his last 10 games, Ty Dellandrea has 1 point (0 goals, 1 assist).
What are Ty Dellandrea's career stats?
Over his NHL career, Ty Dellandrea has 276 games, 17 goals, 45 assists and 62 points. His best season: 2022-23, with 28 points in 82 games.
Where was Ty Dellandrea drafted?
Ty Dellandrea was drafted 13th overall (round 1) by Dallas Stars in 2018.
How does Ty Dellandrea perform in the playoffs?
In the playoffs, Ty Dellandrea has 22 games and 4 points in his career. His pace (0.18 points per game) is similar to his regular-season pace (0.22).
Which player is most similar to Ty Dellandrea?
Jacob Quillan: he is the player at his position whose PAL profile (the 0-to-100 dimensions) is closest to his in 2025-26.
Jacob Quillan's page →Is Ty Dellandrea a good fantasy pick?
Probably not, except in deep leagues: our projection has him at 10 points in 2026-27, or 0.19 points per game.
What is Ty Dellandrea's nationality?
Ty Dellandrea is Canadian. Internationally: Team Canada: assistant captain at the 2018 IIHF World U18 Championships (5th place; 2 goals and 5 points); member of Team Canada at the 2020 World Junior Championship (gold medal; 3 goals and 5 points).
What awards has Ty Dellandrea won?
Flint Firebirds Most Valuable Player (MVP) (2017–18 season). ; Flint Firebirds Combined Academic & Athletics Excellence award (2017–18 season; 4.0 GPA)..
How many championships has Ty Dellandrea won?
1: Gold medal at the 2020 World Junior Championship with Team Canada..
Where did Ty Dellandrea play before turning pro?
Flint Firebirds (OHL), drafted 1st round, 5th overall in the 2016 OHL Priority Selection; played for Flint from 2016 to 2020..
How many points is Ty Dellandrea projected to score in 2026-27?
Our projection has him at 10 points in 53 games in 2026-27 (1 to 20 points, 80% interval), based on his recent seasons, age and role.
See also: his San Jose Sharks teammates
Full roster →

NHL.com ↗ · Stats and photos: NHL (NHL.com)