




Rasmus
Ristolainen
D · PHI · Defensive · Very good
- PAL
- 70
- WAR
- 0.2
- Value
- 56
- PTS
- 14
2025-26№ 142 / 325
Rasmus Ristolainen (Philadelphia Flyers) stats and profile: offensive production, ice time, advanced stats, WAR and PAL rating.
Rasmus Ristolainen
HEIGHT : 193 cm · WEIGHT : 94 kg · SHOOTS : R
Born : October 26, 1994 · Turku, Finland
Drafted : 2013 · BUF · round 1, pick #8
Contract : $5,100,000 · 2022-23 → 2026-27 · Standard Contract (Extension) · UFA
NHL record
| Year | Team | GP | G | A | PTS | PIM |
|---|---|---|---|---|---|---|
| 2026-27 | Philadelphia Flyers | 4 | 1 | 0 | 1 | 0 |
| 2025-26 | Philadelphia Flyers | 44 | 1 | 13 | 14 | 16 |
| 2024-25 | Philadelphia Flyers | 63 | 4 | 15 | 19 | 14 |
| 2023-24 | Philadelphia Flyers | 31 | 1 | 3 | 4 | 8 |
| 2022-23 | Philadelphia Flyers | 74 | 3 | 17 | 20 | 32 |
| 2021-22 | Philadelphia Flyers | 66 | 2 | 14 | 16 | 38 |
| 2020-21 | Buffalo Sabres | 49 | 4 | 14 | 18 | 36 |
| 2019-20 | Buffalo Sabres | 69 | 6 | 27 | 33 | 46 |
| 2018-19 | Buffalo Sabres | 78 | 5 | 38 | 43 | 38 |
| 2017-18 | Buffalo Sabres | 73 | 6 | 35 | 41 | 48 |
| 2016-17 | Buffalo Sabres | 79 | 6 | 39 | 45 | 58 |
| 2015-16 | Buffalo Sabres | 82 | 9 | 32 | 41 | 33 |
| 2014-15 | Buffalo Sabres | 78 | 8 | 12 | 20 | 26 |
| 2013-14 | Buffalo Sabres | 34 | 2 | 2 | 4 | 6 |
| NHL totals | 824 | 58 | 261 | 319 | 399 | |
Playoffs
| Year | Team | GP | G | A | PTS | PIM |
|---|---|---|---|---|---|---|
| 2025-26 | Philadelphia Flyers | 10 | 1 | 4 | 5 | 20 |
| Playoff totals | 10 | 1 | 4 | 5 | 20 | |
Rasmus Ristolainen: our analysis
2025-26 season: 44 GP, 1 G, 13 A, 14 PTS, +10 +/-, 21:23 TOI. WAR 0.2 (142nd of 325) · PAL 70, very good.
In 2025-26, Rasmus Ristolainen, 32, posts a PAL Rating of 70 out of 100 (very good), and his WAR of 0.2 ranks 142nd among 325 regulars, in the top half.
His strengths: discipline (90, among the best in the league), defense (84, well above average) and penalty kill (76, well above average). On the other hand, power play (12, among the weakest in the league) and shooting (27, below average) hold him back.
Breaking down his WAR (goals above average), his biggest contribution: EV defense (+2.5); his biggest cost: finishing (-3.8).
A marked decline: his PAL was 82 in 2024-25, against 70 now; his WAR went from 0.8 to 0.2.
Contract-wise, his Value score of 56 (good value) weighs his output against what he costs: 50 is what that salary should buy.
Rasmus Ristolainen's story
Growing up in Turku, Rasmus Ristolainen learned his craft within the TPS organization, moving through their junior ranks from 2008 and stepping into SM-liiga action with TPS in 2010. Those Finnish seasons put him on international radars and led to a first-round selection by Amur Khabarovsk in the 2012 KHL draft.
The next year he shifted attention west: Buffalo picked him eighth overall in the 2013 NHL Entry Draft. He made his NHL debut on opening night of the 2013–14 campaign, 2 October 2013, and notched his first league goal later that month on 25 October against the Florida Panthers. Two years in, on 10 December 2015, he produced a rare feat for a Sabres defenseman by scoring a hat-trick in a single game.
His time in Buffalo included notable incidents as well as milestones. On 21 March 2017 he was suspended for three games after a check that resulted in an opponent's concussion. After several seasons with the Sabres, he was traded to the Philadelphia Flyers on 23 July 2021 in exchange for Robert Hägg and draft picks, and Philadelphia secured him to a five-year contract extension on 10 March 2022.
Ristolainen has also played decisive minutes for Finland. At the 2014 World Junior Championship he scored the overtime winner in the final on 5 January 2014 to deliver the gold medal against Sweden. He later represented Finland at the 2026 Winter Olympics, where the team earned the bronze medal.
As a defenceman, he blends his Finnish development and extensive NHL experience into a game built around physical engagement and reliable decision-making from the back end. Those attributes have defined his role on the teams he has served and explain why he remains a regular presence on the blueline.
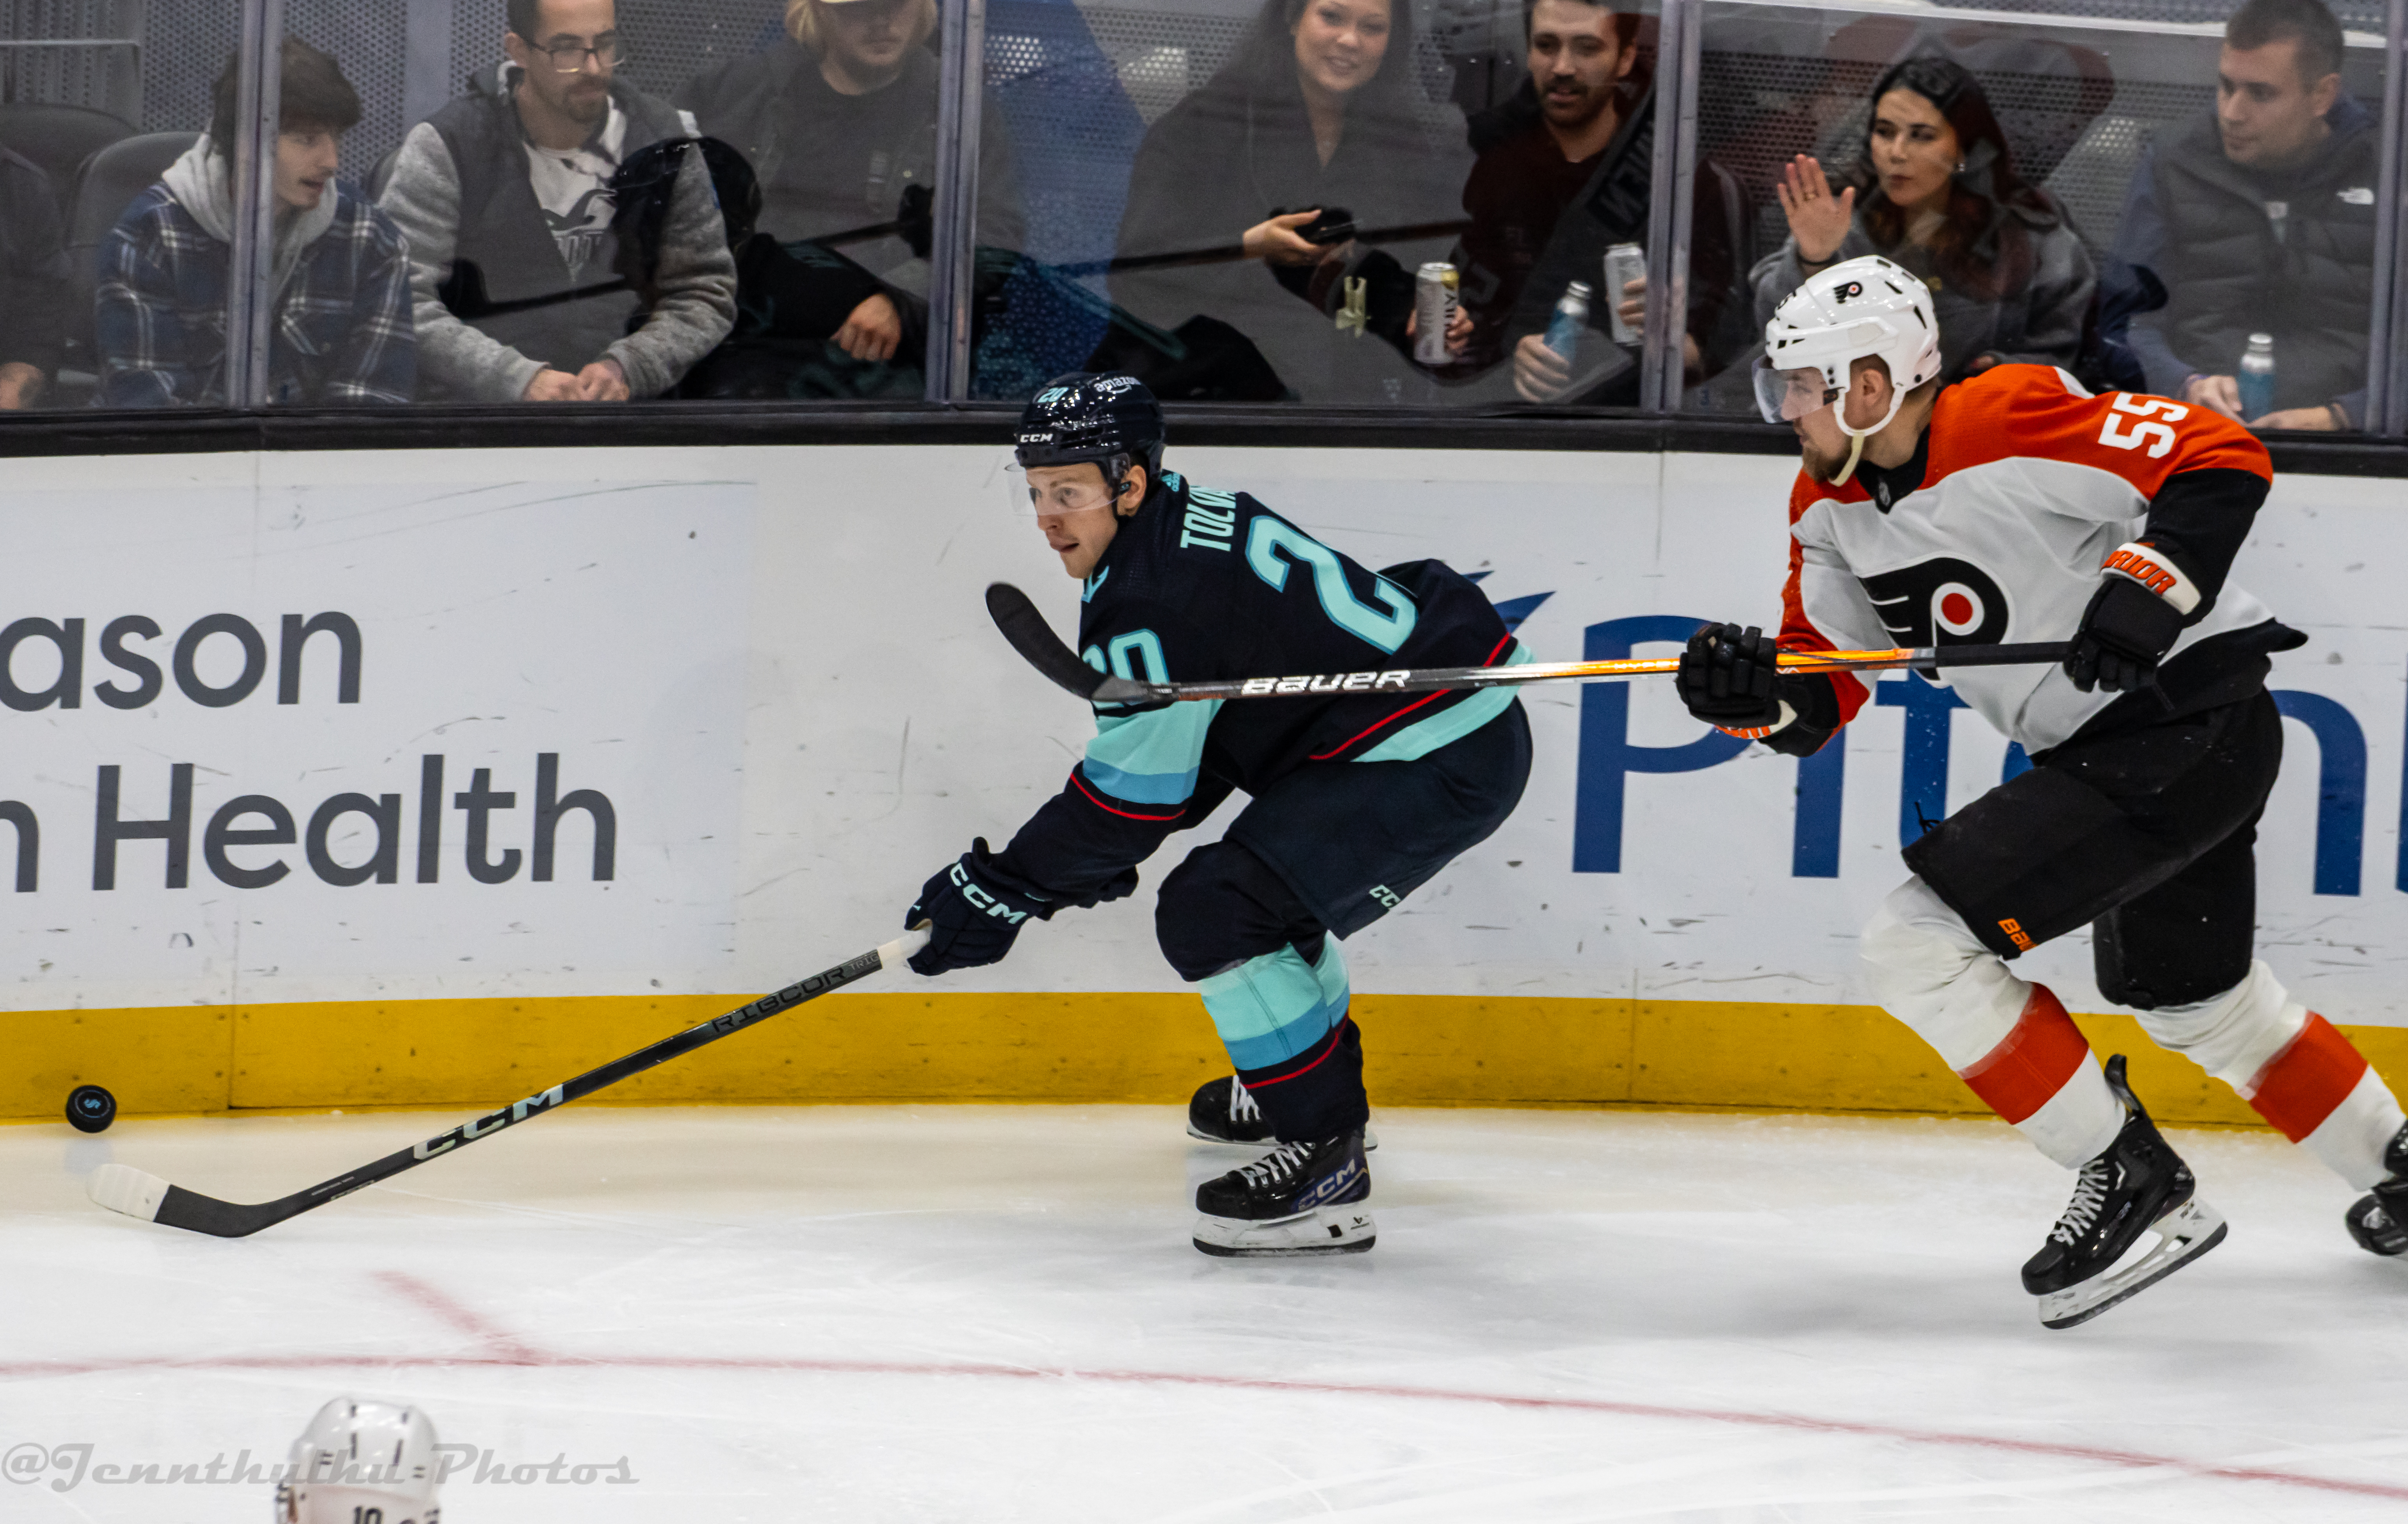


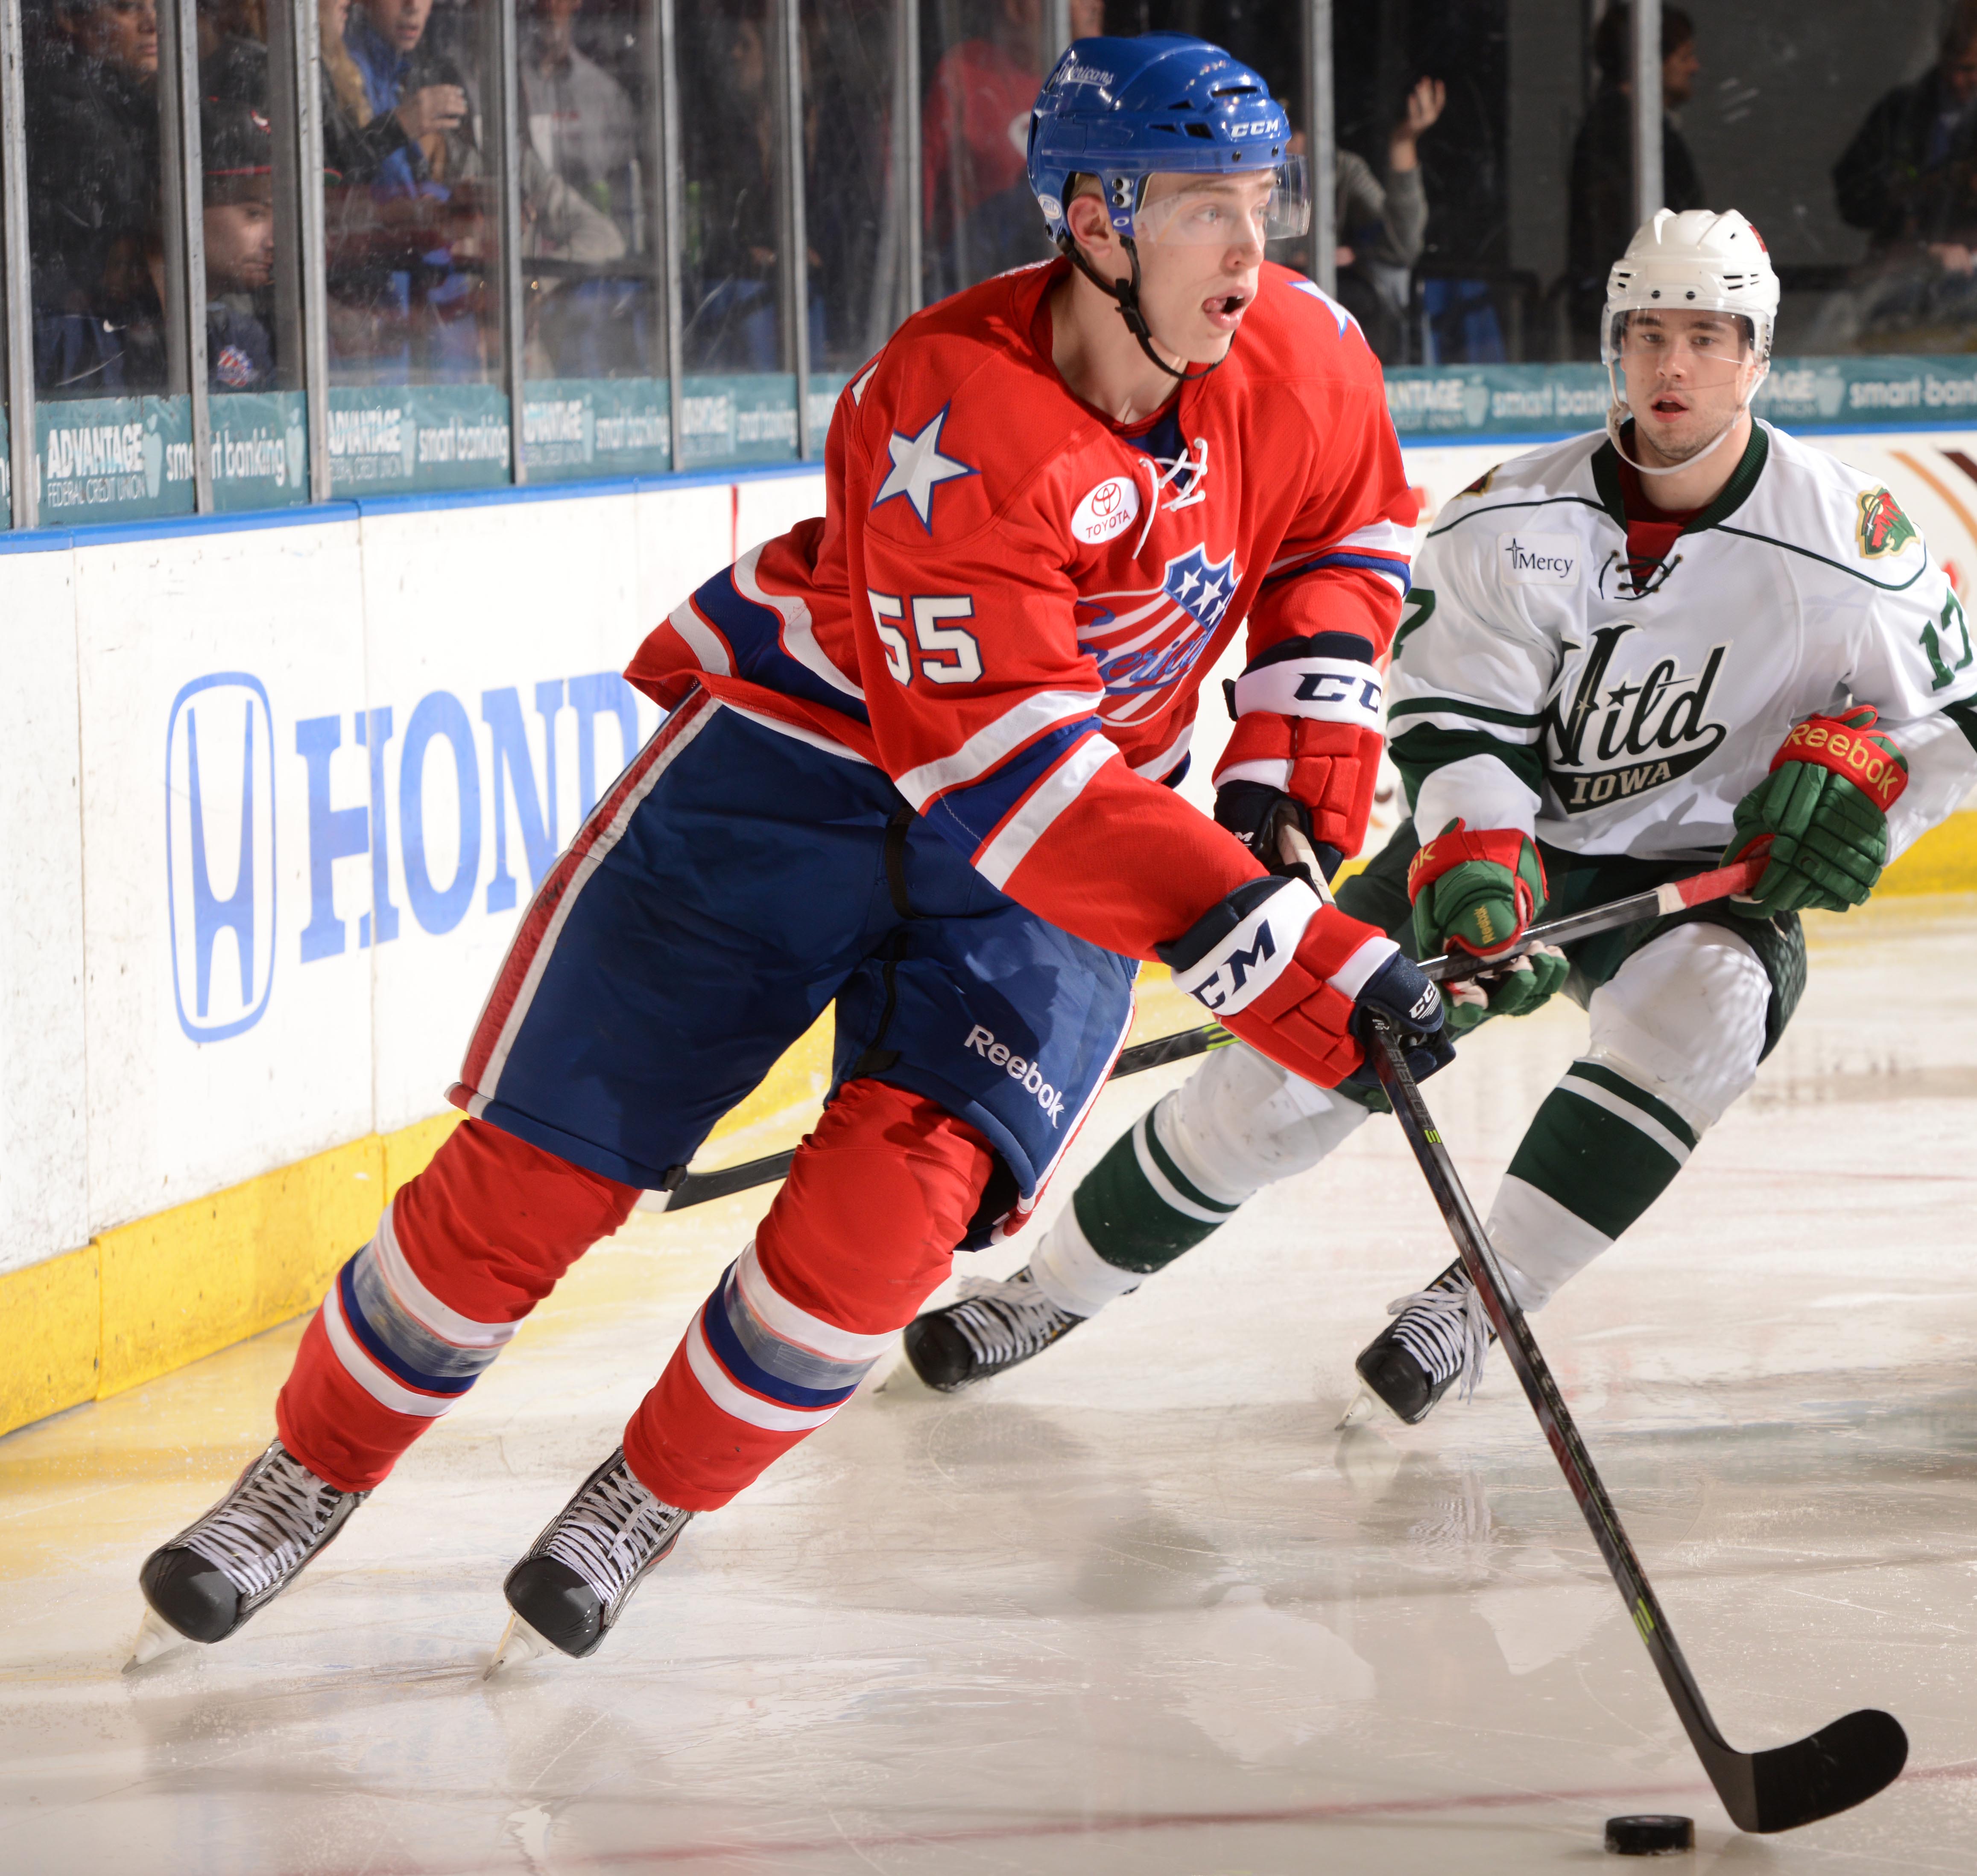
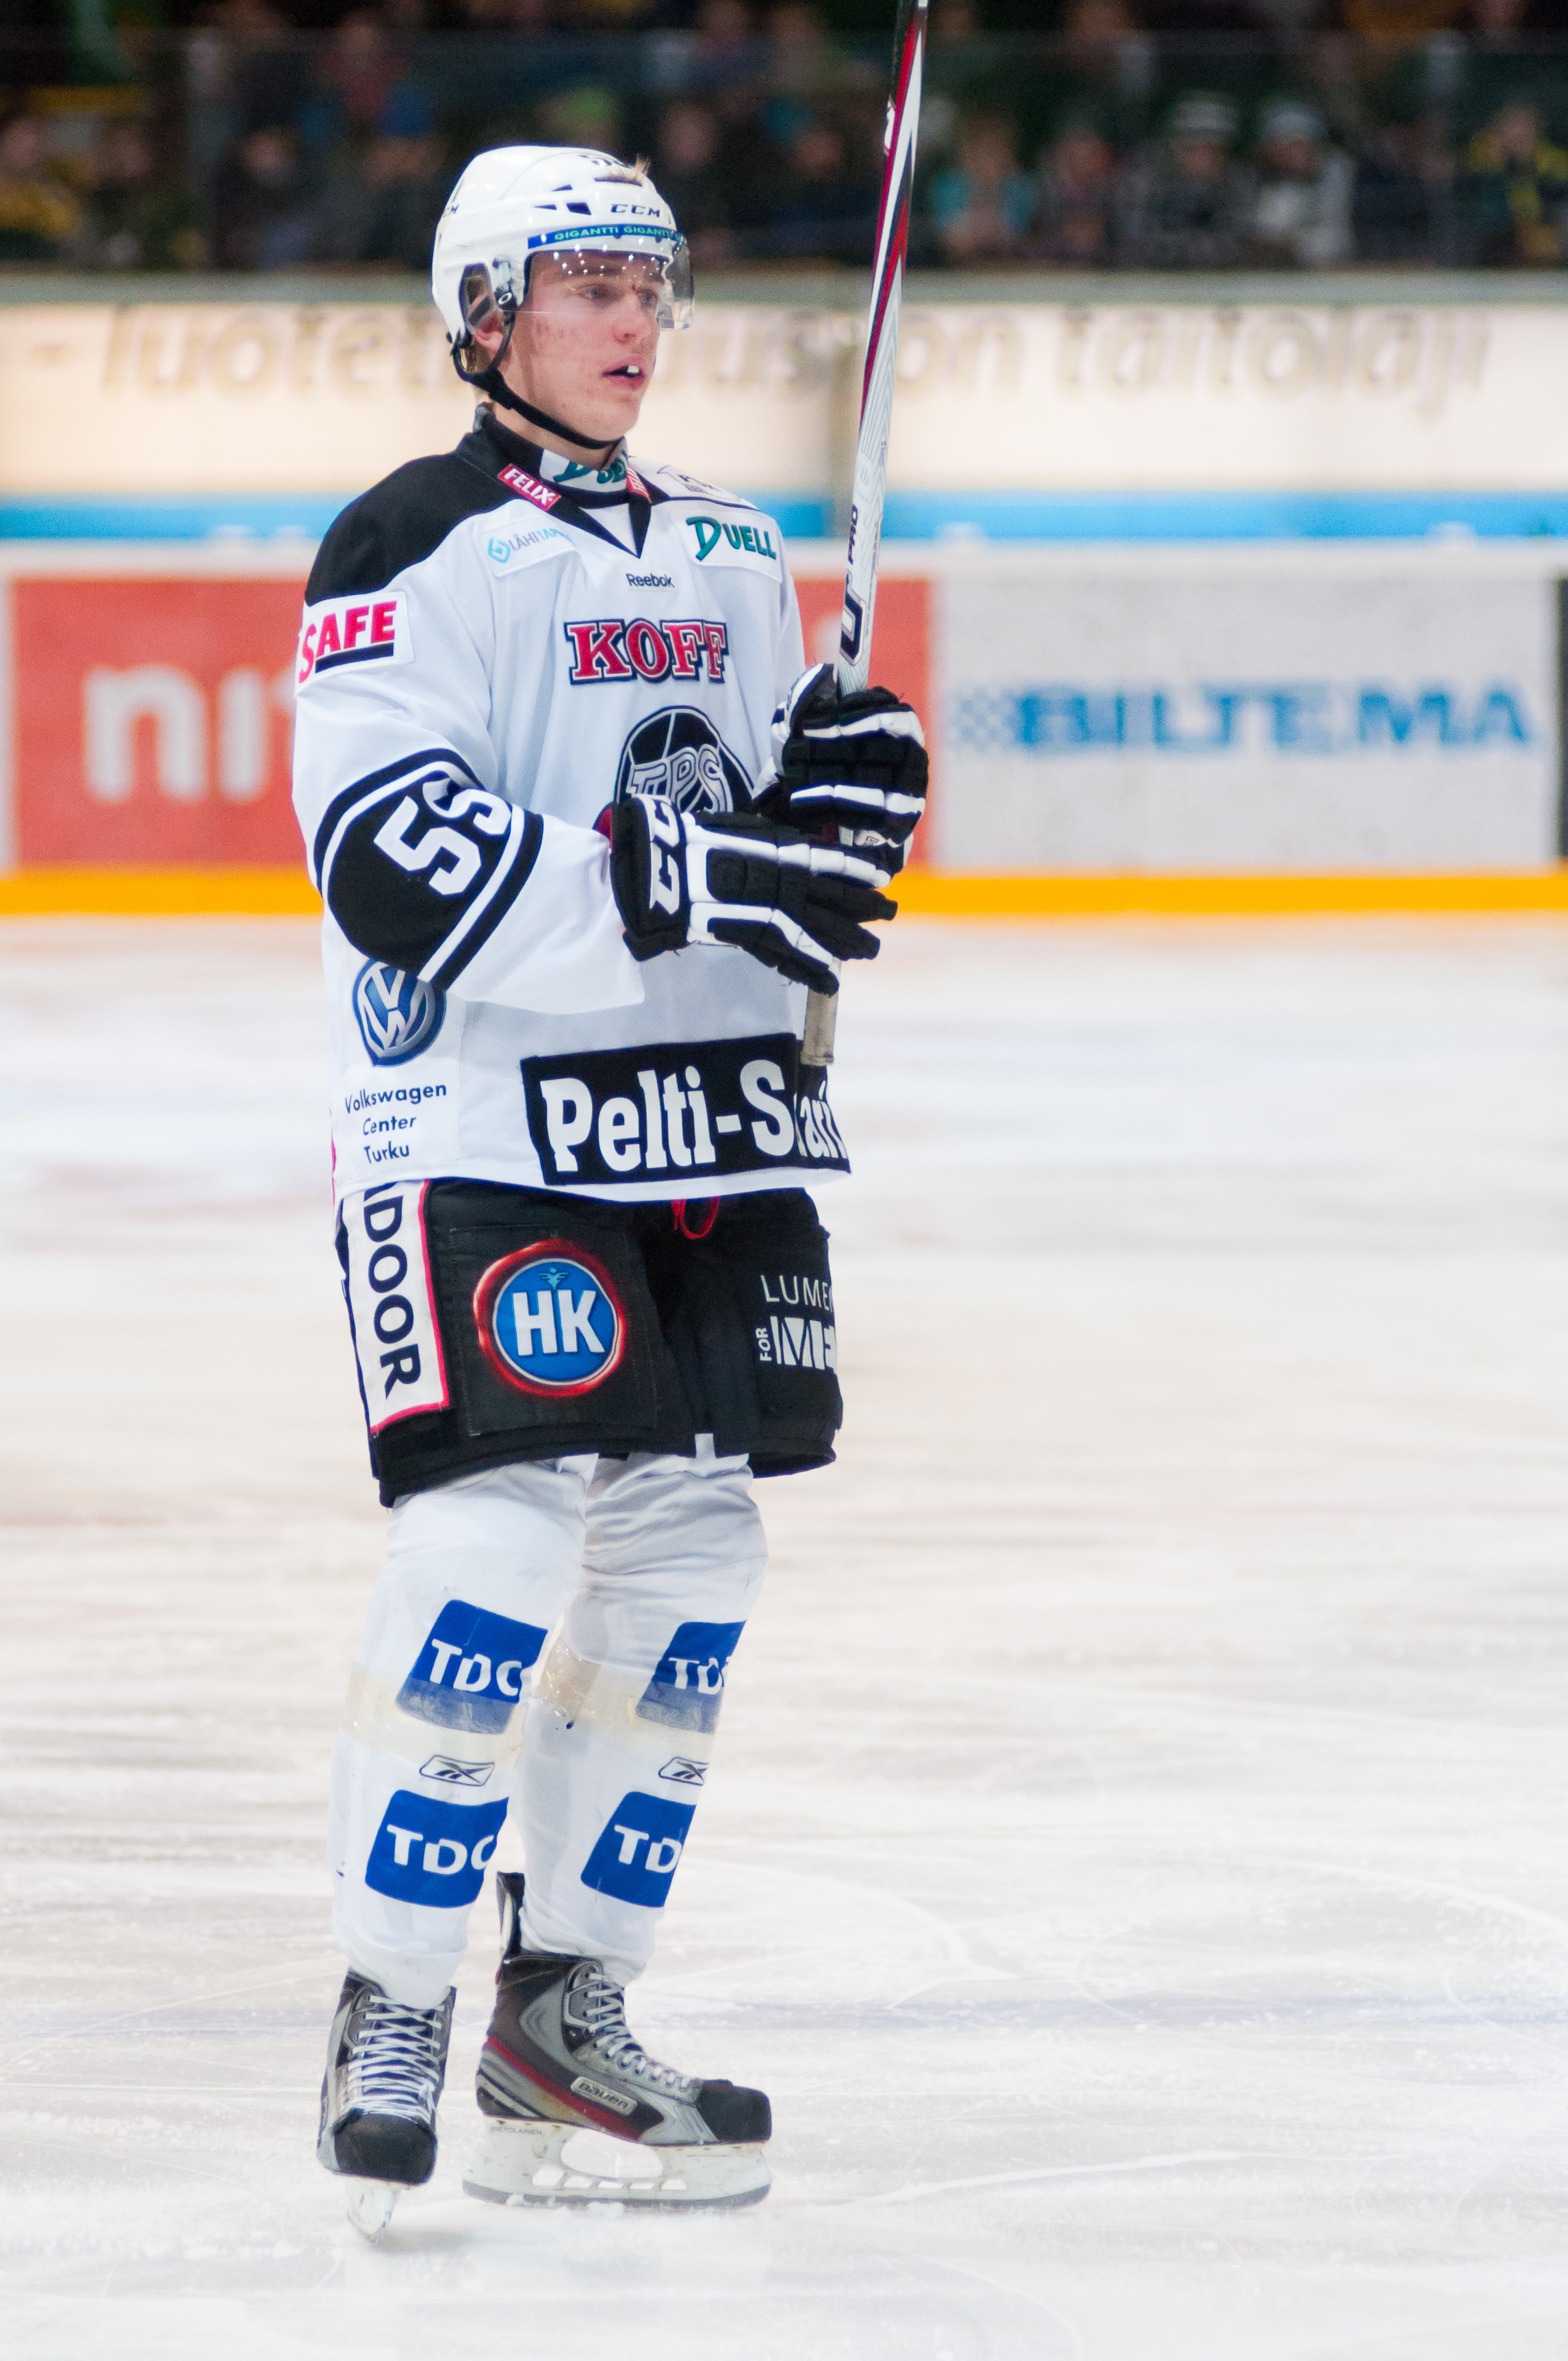
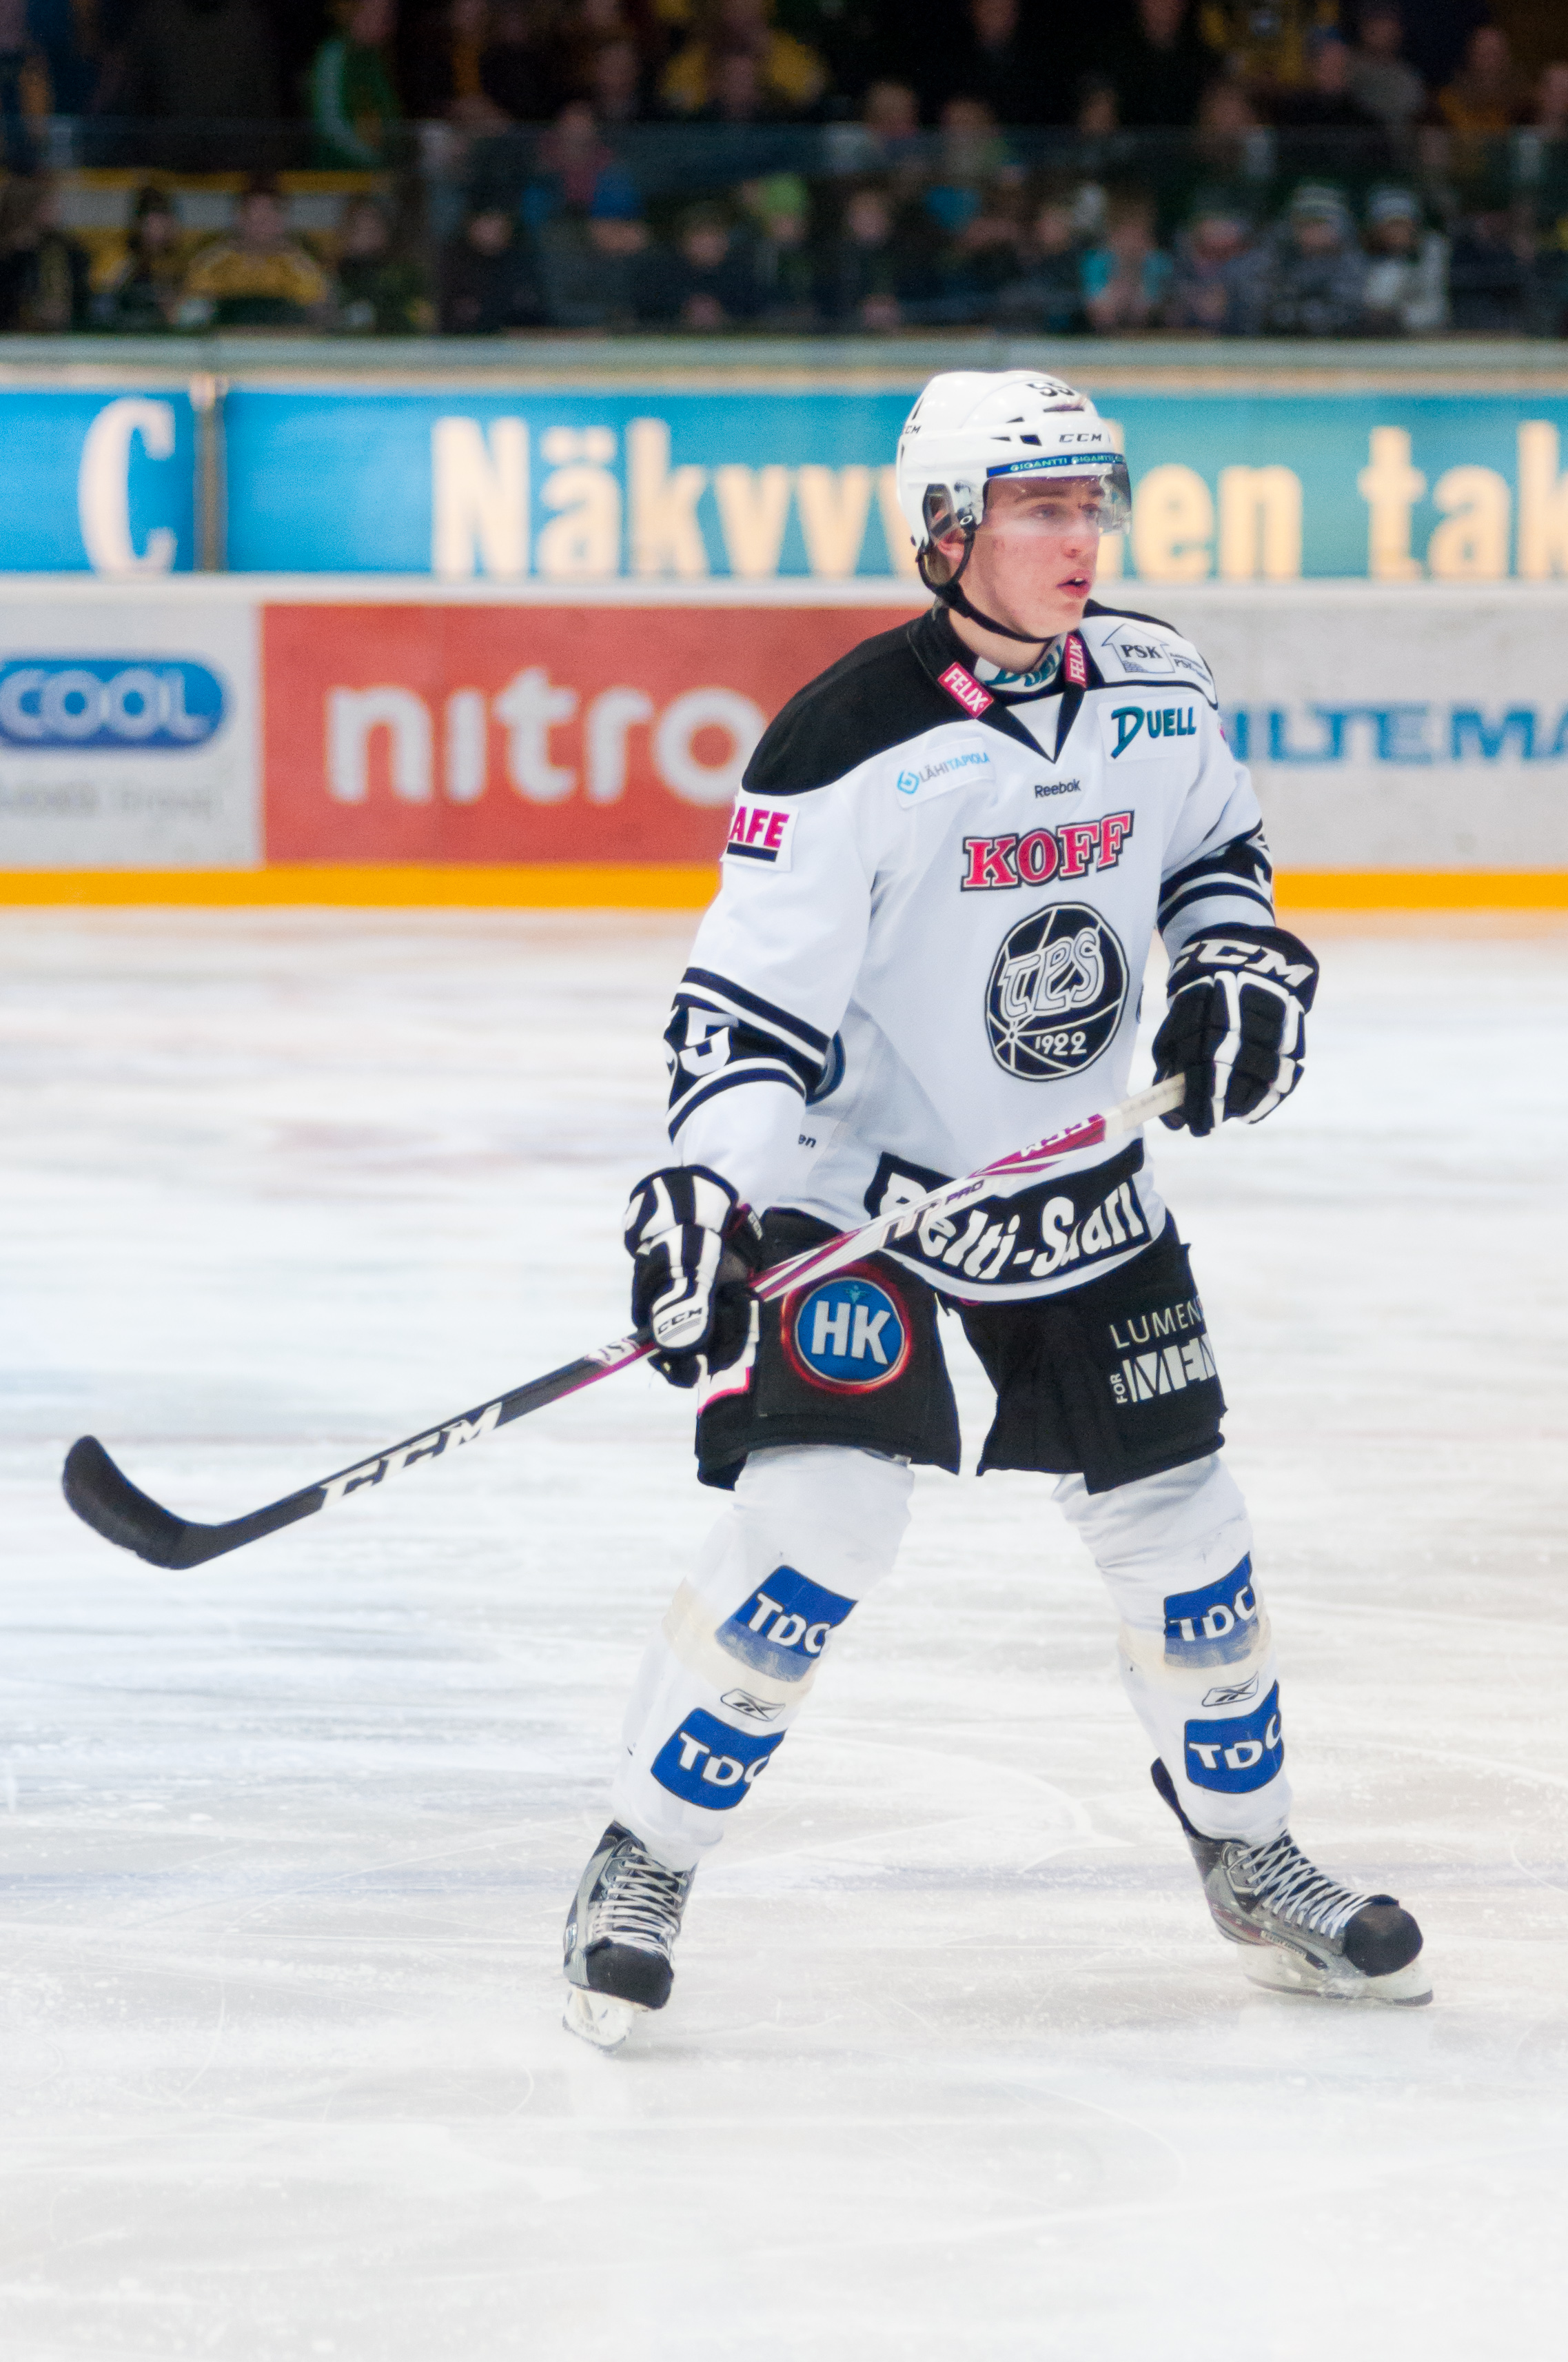
Facts drawn from Wikipédia, told in our own words.
Advanced stats
- TOI/GP
- 17:21
- PP TOI/GP
- 0:04
- SH TOI/GP
- 2:07
- Pts/GP
- 0.25
- EV points
- 1
- Hits
- 7
- Blocks
- 7
- Takeaways
- 1
- Corsi % (SAT)
- 40.3 %
- Off. zone starts
- 31.3 %
Stats and photos: NHL (NHL.com)
2026-27 projection
Projected points
18between 7 and 28 (80% range)
- Goals
- 4
- Assists
- 13
- Games
- 57
So far: 1 pts in 4 games. The team has played 0 of 84 games. Projected pace: 0.32 pts per game (last season: 0.32).
The projection follows last season's pace. Tested on 2,265 player seasons (2022-23 to 2025-26): average miss of 9 points over 82 games; for players at 0.9 points per game and up, it ran 5 points high on average.
Trend
Stable
- Points per game: 0.13 in 23-24, 0.32 in 25-26
- PAL Rating: 82 → 70
Outlook, age included
↘ Slight declineAge 31: the age when production usually declines
This is only a projection. It knows nothing about injuries, trades or role changes; one player in five finishes outside the range.
Player ratings, 2025-26
All ratings →Fourteen ratings from 0 to 100 drawn from data, never by hand: 75 = established NHL player, 95+ = elite.
Injured reserve· Hand· expected back November 11
OV · OverallConfidence 80 %
79
Established NHL
- SK
- Skating
- 68
- Confidence 73 %
- ST
- Strength
- 81
- Confidence 83 %
- EN
- Endurance
- 72
- Confidence 80 %
- DU
- Durability
- 62
- Confidence 77 %
- CK
- Checking
- 79
- Confidence 83 %
- FG
- Fighting
- 69
- Confidence 57 %
- DI
- Discipline
- 85
- Confidence 83 %
- FO
- Faceoffs
- —
- PA
- Passing
- 68
- Confidence 80 %
- SC
- Scoring
- 65
- Confidence 80 %
- DF
- Defense
- 88
- Confidence 77 %
- PS
- Penalty shot
- 76
- Confidence 0 %
- EX
- Experience
- 82
- Confidence 100 %
Why these ratings?Hide details
SK — Skating68
- Top speed (35 %)35.1 · 70
- Bursts > 20 mph /60 (30 %)1.653 · 72
- Distance /60 (20 %)13.8 · 63
- Speed consistency (15 %)34.3 · 70
ST — Strength81
- Contact absorbed /60 (50 %)5.904 · 80
- Body mass (50 %)0.575 · 78
EN — Endurance72
- Ice time per game (45 %)19.6 · 77
- Total ice time (20 %)908 · 66
- Shift length (15 %)44.5 · 63
- Lowest recent ice time per game (15 %)16.4 · 69
- Special-teams time per game (5 %)2.735 · 80
DU — Durability62
- Share of games played (100 %)0.706 · 62
CK — Checking79
- Hits /60 (70 %)4.217 · 80
- Lowest seasonal rate (20 %)3.151 · 77
- Season volume (10 %)3.892 · 74
FG — Fighting69
- Fights per 82 games (100 %)0.741 · 69
DI — Discipline85
- Net penalty value /60 (50 %)-0.009 · 85
- Penalties taken /60 (30 %)0.512 · 80
- Penalties drawn /60 (20 %)0.458 · 79
PA — Passing68
- Primary assists /60 (40 %)0.279 · 64
- Secondary assists /60 (20 %)0.51 · 81
- Offensive creation (RAPM) (20 %)-0.001 · 75
- Power-play points /60 (10 %)3.224 · 53
- Assist consistency (10 %)0.148 · 63
SC — Scoring65
- Goals /60 (25 %)0.15 · 64
- Individual xG /60 (20 %)0.235 · 79
- Finishing (goals − xG per shot) (20 %)-0.48 · 37
- High-danger chances /60 (15 %)0.114 · 76
- xG per shot (10 %)0.036 · 81
- Shot attempts /60 (10 %)9.435 · 73
DF — Defense88
- RAPM defense /60 (35 %)0.145 · 87
- Relative xG against (20 %)-0.067 · 79
- On-ice xG against /60 (15 %)2.405 · 88
- Penalty kill /60 (10 %)0.129 · 85
- Takeaways − giveaways /60 (10 %)-1.534 · 85
- Shot attempts against /60 (5 %)54.4 · 92
- Blocked shots /60 (5 %)4.621 · 77
PS — Penalty shot76
- Shootouts (60 %)32.7 · 76
- Penalty shots (40 %)26.7 · 76
EX — Experience82
- Career regular-season games (65 %)95
- Career playoff games (25 %)45
- NHL seasons (10 %)90
OV — Overall79
- DF · Defense (30 %)88
- PA · Passing (22 %)68
- SK · Skating (12 %)68
- SC · Scoring (12 %)65
- EN · Endurance (9 %)72
- ST · Strength (6 %)81
- DI · Discipline (5 %)85
- CK · Checking (4 %)79
| Season | OV | SK | SC | DF |
|---|---|---|---|---|
| 2025-26 | 79 | 68 | 65 | 88 |
| 2024-25 | 82 | 70 | 71 | 89 |
| 2023-24 | 79 | 66 | 71 | 88 |
| 2022-23 | 81 | 69 | 69 | 87 |
The bars show confidence (sample size), not player quality. — : not enough data, not a zero. Engine version 1.0.
WAR and PAL ratings, 2025-26
How we rate →PAL Rating scores performance from 0 to 100 against players at the same position (50 = average player), starting from the player's strength, offensive or defensive. Value Rating compares that performance with what the player costs: 50 means paid what the play is worth.
WAR
0.2
wins above replacement
142 of 325
PAL Rating
70/ 100
Performance · Very good
70 of 250 at the position
Value Rating
56/ 100
Good value
5.10 M$ · expected PAL 65
ProfileDefensiveValue comes mostly from defense
- Offense
- 42
- Defense
- 81
See full detailsHide details
- Offense
- 30
- Creation
- 54
- Shooting
- 27
- Possession
- 68
- Defense
- 84
- Discipline
- 90
- Power play
- 12
- Penalty kill
- 76
From 0 to 100; 50 is the average player at the same position, adjusted for ice time.
| Season | Team | WAR | PAL | Value | Cap hit |
|---|---|---|---|---|---|
| 2025-26 | PHI | 0.2 | 70 | 56 | 5.10 M$ |
| 2024-25 | PHI | 0.8 | 82 | 65 | 5.10 M$ |
| 2023-24 | PHI | 0.3 | 73 | 55 | 5.10 M$ |
| 2022-23 | PHI | 0.4 | 65 | 44 | 5.10 M$ |
Hockey IQ, 2025-26
Rankings and method →The quality of the player's decisions with and against the puck at 5-on-5, against regulars at the same position (50 = average). PAL measures output; IQ measures how the player plays.
Overall IQ
91/ 100
Elite
better than 91% of defensemen, offense and defense combined
Offensive IQ
94/ 100
Elite
passing, shots, puck
Defensive IQ
68/ 100
Average
takeaways, discipline, own zone
Overall IQ isn't an average of the two scores: it's the player's rank with offense and defense combined, 20 of 225 defensemen.
See full detailsHide details
Offense
- Playmaking passes
- 52
- Shot selection
- 87
- Penalties drawn
- 86
- Puck management
- 97
Defense
- Takeaways
- 42
- Discipline
- 89
- Safe zone exits
- 31
Percentiles: 80 means better than 80% of regulars at the same position. Play without the puck (positioning, coverage) isn't measured: the NHL doesn't publish that data.
| Season | Team | IQ | Off. | Def. |
|---|---|---|---|---|
| 2025-26 | PHI | 91 | 94 | 68 |
| 2024-25 | PHI | 83 | 59 | 89 |
| 2023-24 | PHI | 75 | 76 | 62 |
| 2022-23 | PHI | 25 | 59 | 18 |
WAR, 2025-26
How it's calculated →Wins added to the team, compared with a replacement-level player called up from the AHL.
0.2
wins above replacement
-0.2 to 0.6 — 90% interval
142 of 325 defensemen
+1.1 goals above replacement
Full leaderboard →See full detailsHide details
- EV offense
- -0.1
- EV defense
- +2.5
- Power play
- -0.1
- Penalty kill
- +0.3
- Shooting
- -3.8
- Penalties
- +0.3
- Average → replacement
- +1.9
In goals.
| Season | Team | GP | WAR | 90% interval | Rank |
|---|---|---|---|---|---|
| 2025-26 | PHI | 44 | 0.2 | -0.2 to 0.6 | 142/325 |
| 2024-25 | PHI | 63 | 0.8 | 0.3 to 1.4 | 61/314 |
| 2023-24 | PHI | 31 | 0.3 | 0.1 to 0.8 | 111/316 |
| 2022-23 | PHI | 74 | 0.4 | -0.5 to 1.5 | 93/334 |
Player tracking (NHL EDGE)
League EDGE leaderboards →Speed, shot power, distance covered, time by zone: measured by chips in the puck and shoulder pads. 90th percentile = better than 90% of players.
- Hardest shot
- 158.1 km/h98th percentileleague avg. 139.7 km/h
- Top skating speed
- 34.3 km/h56th percentileleague avg. 34.0 km/h
- Bursts over 20 mph, season
- 110th percentileleague avg. 8
- Offensive zone time
- 36.3 %1st percentileleague avg. 42.4 %
See full detailsHide details
- Total distance, season
- 15.4 km13th percentileleague avg. 56.1 km
- Distance, single-game high
- 5.01 km49th percentileleague avg. 4.98 km
- Offensive zone at 5v5
- 36.4 %0th percentileleague avg. 42.8 %
- Neutral zone time
- 18.0 %46th percentileleague avg. 16.9 %
- Defensive zone time
- 45.7 %3rd percentileleague avg. 40.8 %
Shooting
| Shots on goal | Goals | Shooting % | |
|---|---|---|---|
| All | 520th percentile | 172nd percentile | 20.0 %98th percentile |
| High danger | 175th percentile | 198th percentile | 100.0 %100th percentile |
| Mid range | 136th percentile | 073rd percentile | 0.0 %50th percentile |
| Long range | 222nd percentile | 077th percentile | 0.0 %67th percentile |
Shots on goal by zone
2026-2027 regular season. Measured by puck and player tracking chips; the percentile ranks the player within the league.
Game log, 2026-27
 ANA
 CAR
 NJD
 PIT
Rasmus Ristolainen: frequently asked questions
How many goals does Rasmus Ristolainen have in 2026-27?
Rasmus Ristolainen has 1 goal and 1 point (0 assists) in 4 games in 2026-27.
How old is Rasmus Ristolainen?
Rasmus Ristolainen is 32 years old: he was born on October 27, 1994.
How tall is Rasmus Ristolainen, and how much does he weigh?
Rasmus Ristolainen is 6'4" (193 cm) and weighs 207 lb (94 kg).
Where is Rasmus Ristolainen from?
Finland: Rasmus Ristolainen was born in Turku, Finland.
What team does Rasmus Ristolainen play for?
Rasmus Ristolainen plays for the Philadelphia Flyers in the NHL, at D, wearing number 55.
Is Rasmus Ristolainen injured?
Yes: Rasmus Ristolainen is on injured reserve (hand). He is expected back around November 11.
How good is Rasmus Ristolainen?
Rasmus Ristolainen produced 0.2 wins above replacement (WAR) in 2025-26, 142nd of 325 players at his position in the NHL. His PAL rating is 70 out of 100: very good for his position.
How much does Rasmus Ristolainen make?
Rasmus Ristolainen earns $5.1M for the 2025-26 season. His Value Rating is 56 out of 100 (good value): it measures the on-field return for that salary, compared with players at his position.
When does Rasmus Ristolainen's contract end?
Rasmus Ristolainen's contract runs through the 2026-27 season; he will then be an unrestricted free agent.
Is Rasmus Ristolainen overpaid?
No, he gives more than he costs. His Value rating is 56 out of 100 (good value), where 50 is the output expected for his salary, compared with players at his position.
Is Rasmus Ristolainen a top-10 player at his position?
No: by WAR, he ranks 142nd of 325 players at his position in the NHL in 2025-26. Our comparison tool puts him side by side with any other player.
Is Rasmus Ristolainen getting better?
No, he is slipping: his PAL rating went from 82 in 2024-25 to 70 in 2025-26 (out of 100, 50 = average player at his position).
How has Rasmus Ristolainen played lately?
Over his last 4 games, Rasmus Ristolainen has 1 point (1 goal, 0 assists).
What are Rasmus Ristolainen's career stats?
Over his NHL career, Rasmus Ristolainen has 824 games, 58 goals, 261 assists and 319 points. His best season: 2016-17, with 45 points in 79 games.
Where was Rasmus Ristolainen drafted?
Rasmus Ristolainen was drafted 8th overall (round 1) by Buffalo Sabres in 2013.
How does Rasmus Ristolainen perform in the playoffs?
In the playoffs, Rasmus Ristolainen has 10 games and 5 points in his career. His pace (0.50 points per game) is higher than his regular-season pace (0.39).
Which player is most similar to Rasmus Ristolainen?
Matt Roy: he is the player at his position whose PAL profile (the 0-to-100 dimensions) is closest to his in 2025-26.
Matt Roy's page →Is Rasmus Ristolainen a good fantasy pick?
Probably not, except in deep leagues: our projection has him at 18 points in 2026-27, or 0.32 points per game.
What is Rasmus Ristolainen's nationality?
Rasmus Ristolainen is Finnish. Internationally: represented Finland; 2014 World Junior Champion (scored the overtime winner in the final); bronze medal at the 2026 Winter Olympics.
How many points is Rasmus Ristolainen projected to score in 2026-27?
Our projection has him at 18 points in 57 games in 2026-27 (7 to 28 points, 80% interval), based on his recent seasons, age and role.
See also: his Philadelphia Flyers teammates
Full roster →


NHL.com ↗ · Stats and photos: NHL (NHL.com)