PickALeague.com
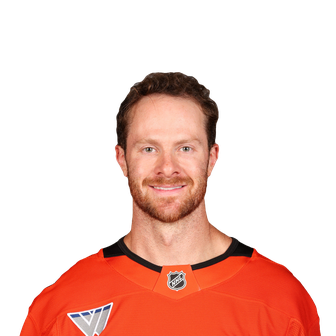
4BaseNick Jensen headshot

Nick

Jensen

D · ANA · Limited · Below average

PAL
23
WAR
0.5
Value
17
PTS
17

2025-26№ 101 / 325

Nick Jensen (Anaheim Ducks) stats, profile and latest news: offensive production, ice time, advanced stats and headlines.

Nick Jensen

#4DAnaheim Ducks logoAnaheim Ducks

HEIGHT : 183 cm · WEIGHT : 91 kg · SHOOTS : R

Born : September 20, 1990 · Rogers, United States

Drafted : 2009 · DET · round 5, pick #150

Contract : $2,250,000 · 2026-27 → 2027-28 · Standard Contract · UFA

NHL record

Year Team GPGAPTSPIM
2026-27Anaheim Ducks31122
2025-26Ottawa Senators614131722
2024-25Ottawa Senators71318216
2023-24Washington Capitals781131410
2022-23Washington Capitals775242918
2021-22Washington Capitals765162121
2020-21Washington Capitals532121414
2019-20Washington Capitals6808813
2018-19Washington Capitals200554
2018-19Detroit Red Wings602131517
2017-18Detroit Red Wings810151527
2016-17Detroit Red Wings49491312
NHL totals69727147174166

Playoffs

Year Team GPGAPTSPIM
2024-25Ottawa Senators60002
2023-24Washington Capitals10002
2021-22Washington Capitals60004
2020-21Washington Capitals50002
2019-20Washington Capitals80000
2018-19Washington Capitals70002
Playoff totals3300012

Nick Jensen: our analysis

2025-26 season: 61 GP, 4 G, 13 A, 17 PTS, -2 +/-, 17:01 TOI. WAR 0.5 (101st of 325) · PAL 23, below average.

In 2025-26, Nick Jensen, 36, posts a PAL Rating of 23 out of 100 (below average), and his WAR of 0.5 ranks 101st among 325 regulars, in the top half.

On the other hand, penalty kill (9, among the weakest in the league) and creation (9, among the weakest in the league) hold him back.

Breaking down his WAR (goals above average), his biggest contribution: finishing (+1.8); his biggest cost: EV offense (-1.6).

A marked decline: his PAL was 37 in 2024-25, against 23 now; his WAR went from 0.5 to 0.5.

Contract-wise, his Value score of 17 (very poor return) weighs his output against what he costs: 50 is what that salary should buy.

Nick Jensen's story

Growing up in Saint Paul, Minnesota, Jensen carried a hockey pedigree into organized junior play: after skating for Rogers High School he moved to the Green Bay Gamblers in the USHL, where he helped win the Clark Cup in 2010 and earned a spot in the league All-Star game.

He then spent three seasons at St. Cloud State in the WCHA, developing into a defenseman who could contribute at both ends. Jensen collected conference honours in 2012–13, including WCHA Defensive Player of the Year and a place on the NCAA West First All-American Team, and left college with a résumé that matched the Detroit Red Wings' decision to draft him 150th overall in 2009.

Jensen began his professional career in Detroit's system, logging significant time with the Grand Rapids Griffins in the AHL and occasional assignments to Toledo in the ECHL before making his NHL debut in December 2016. He scored his first NHL goal in January 2017 and established himself over subsequent seasons with the Red Wings until a trade sent him to Washington on 22 February 2019. The Capitals signed him to a four-year extension upon arrival; he became a regular on the Washington blueline, played in multiple playoff runs and later agreed to a three-year extension in February 2023.

On the international stage Jensen represented the United States at the 2018 IIHF World Championship, recording one goal and three assists in 10 games en route to a bronze medal. He was traded to the Ottawa Senators on 1 July 2024 as part of the exchange for Jakob Chychrun. With Ottawa he debuted in October, picked up his first point and scored his first goal for the club, played a heavy workload alongside established partners, and appeared in the opening-round series against Toronto.

On the ice, Jensen's game blends steady skating, physical engagement along the boards and a capacity to start plays out of his own zone rather than high-end offensive production. His career includes several injuries requiring time off and surgical procedures; most recently he signed a two-year contract with the Anaheim Ducks on 1 July 2026.

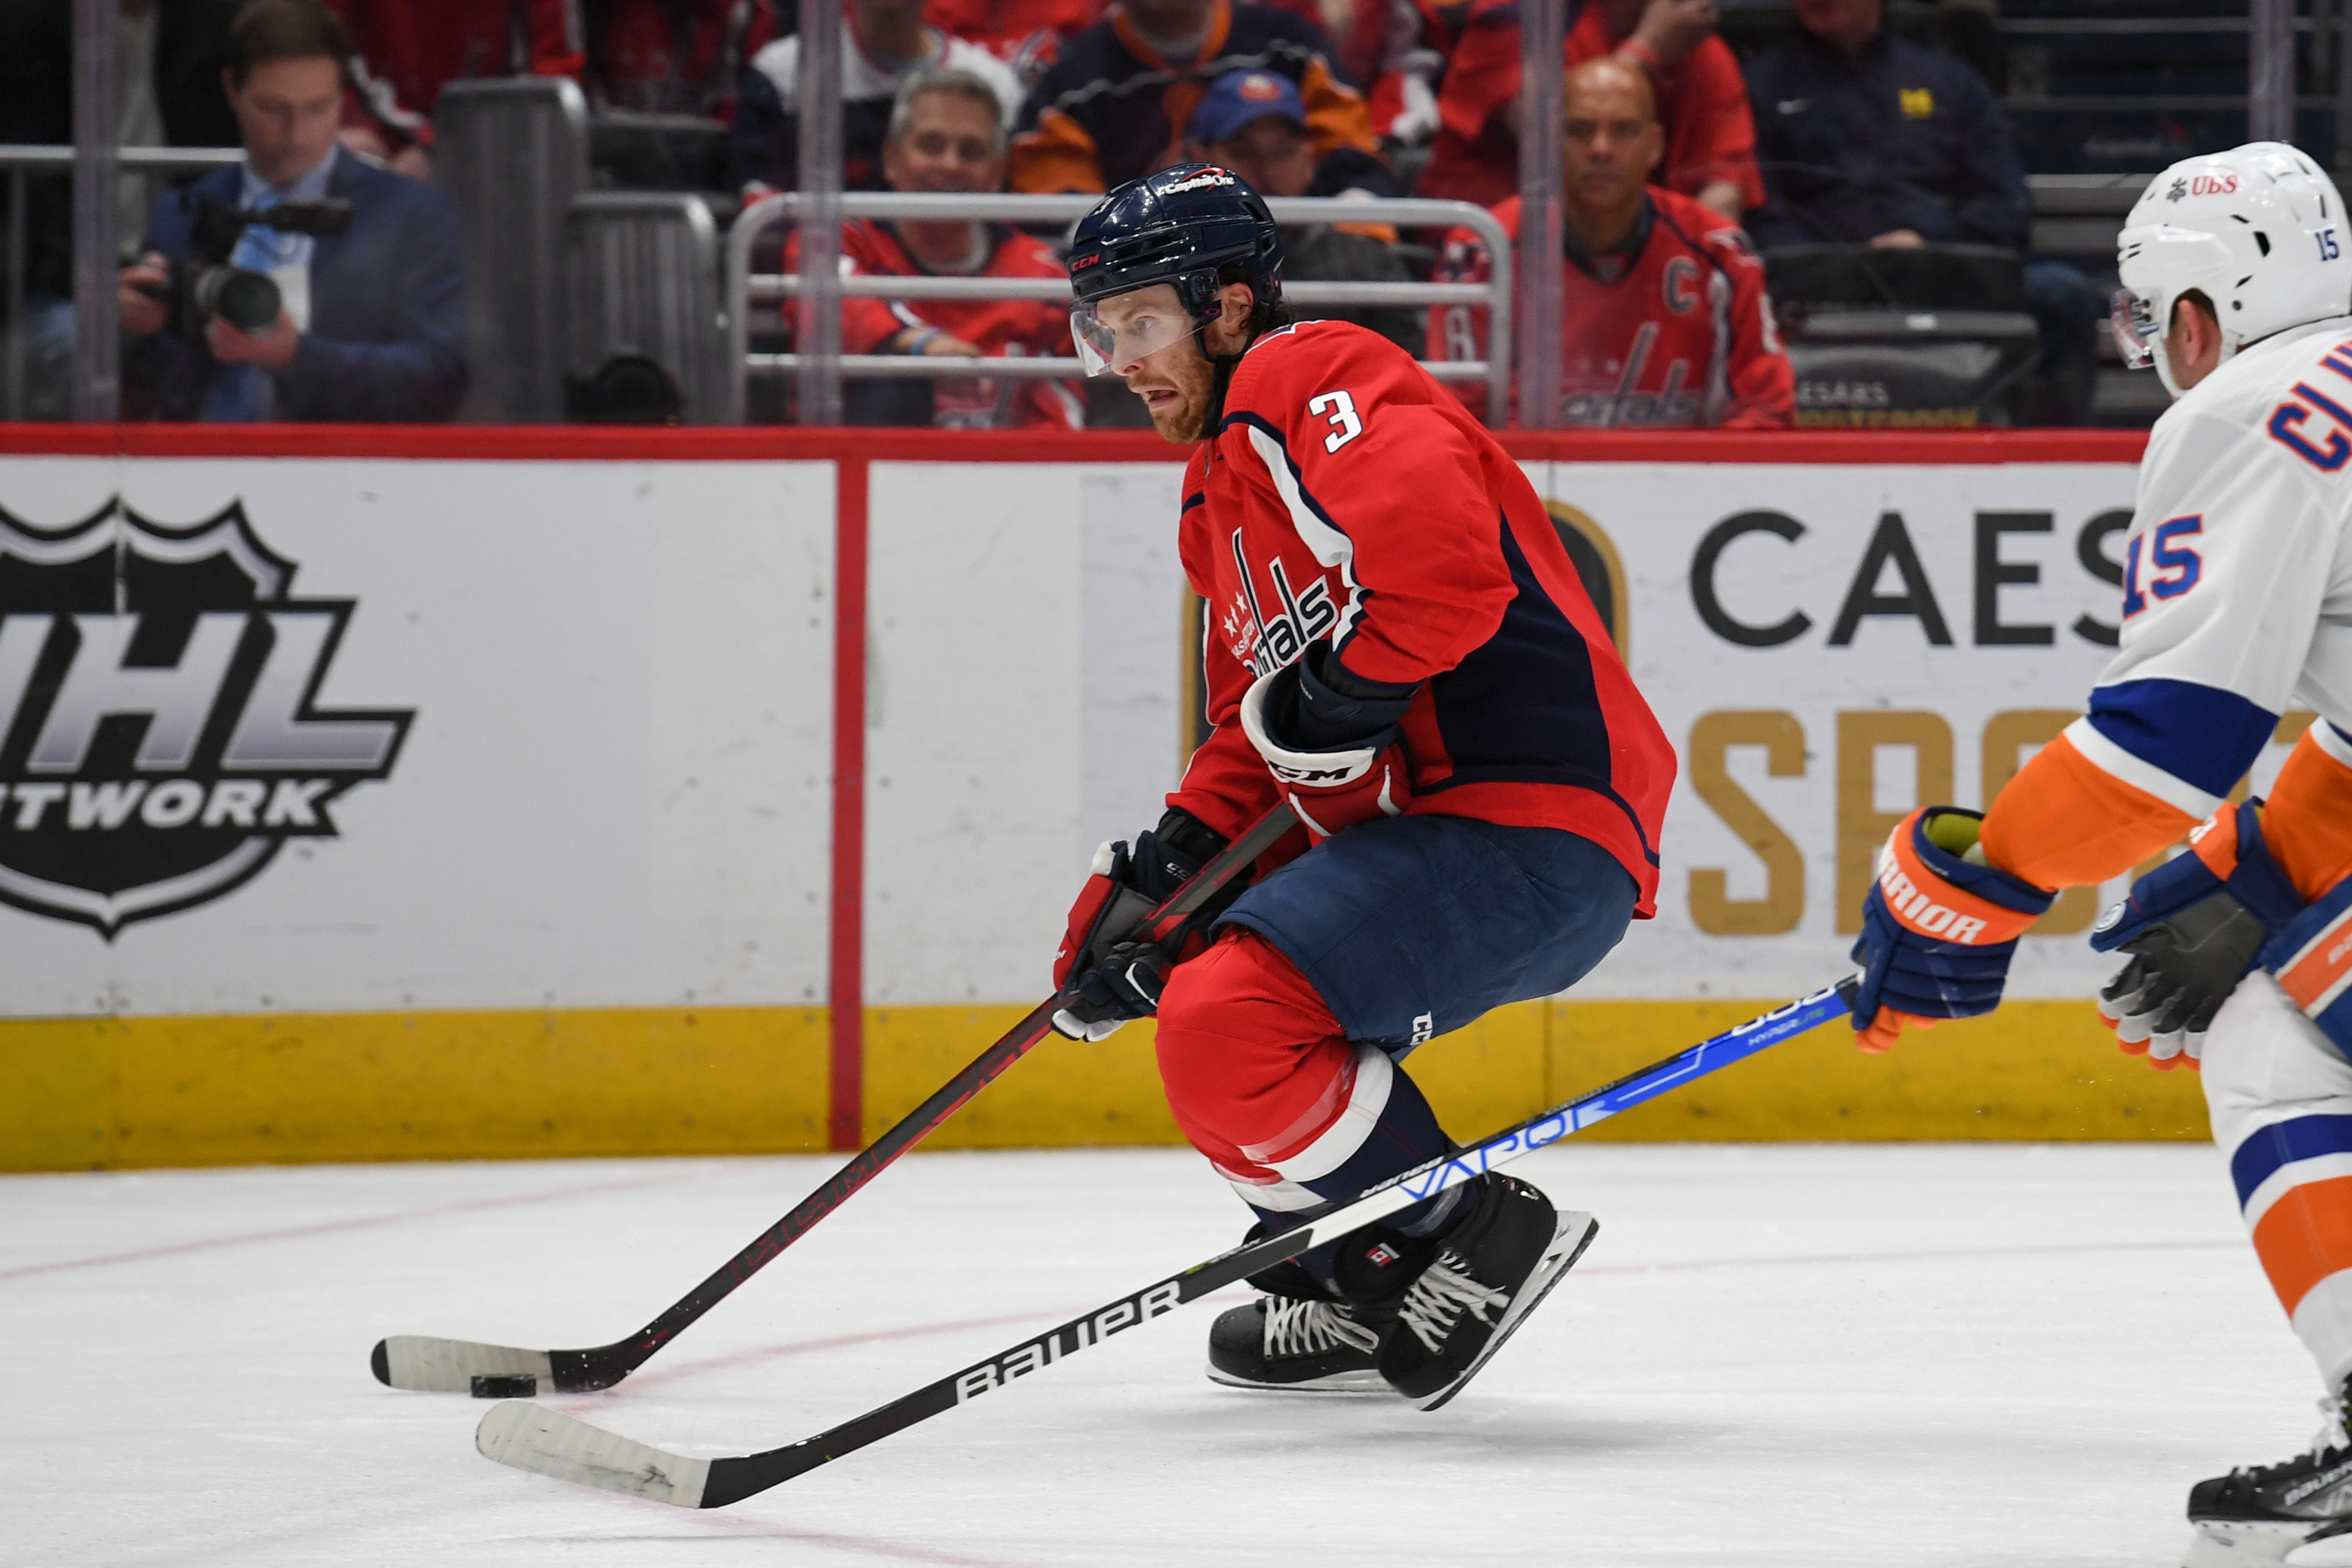
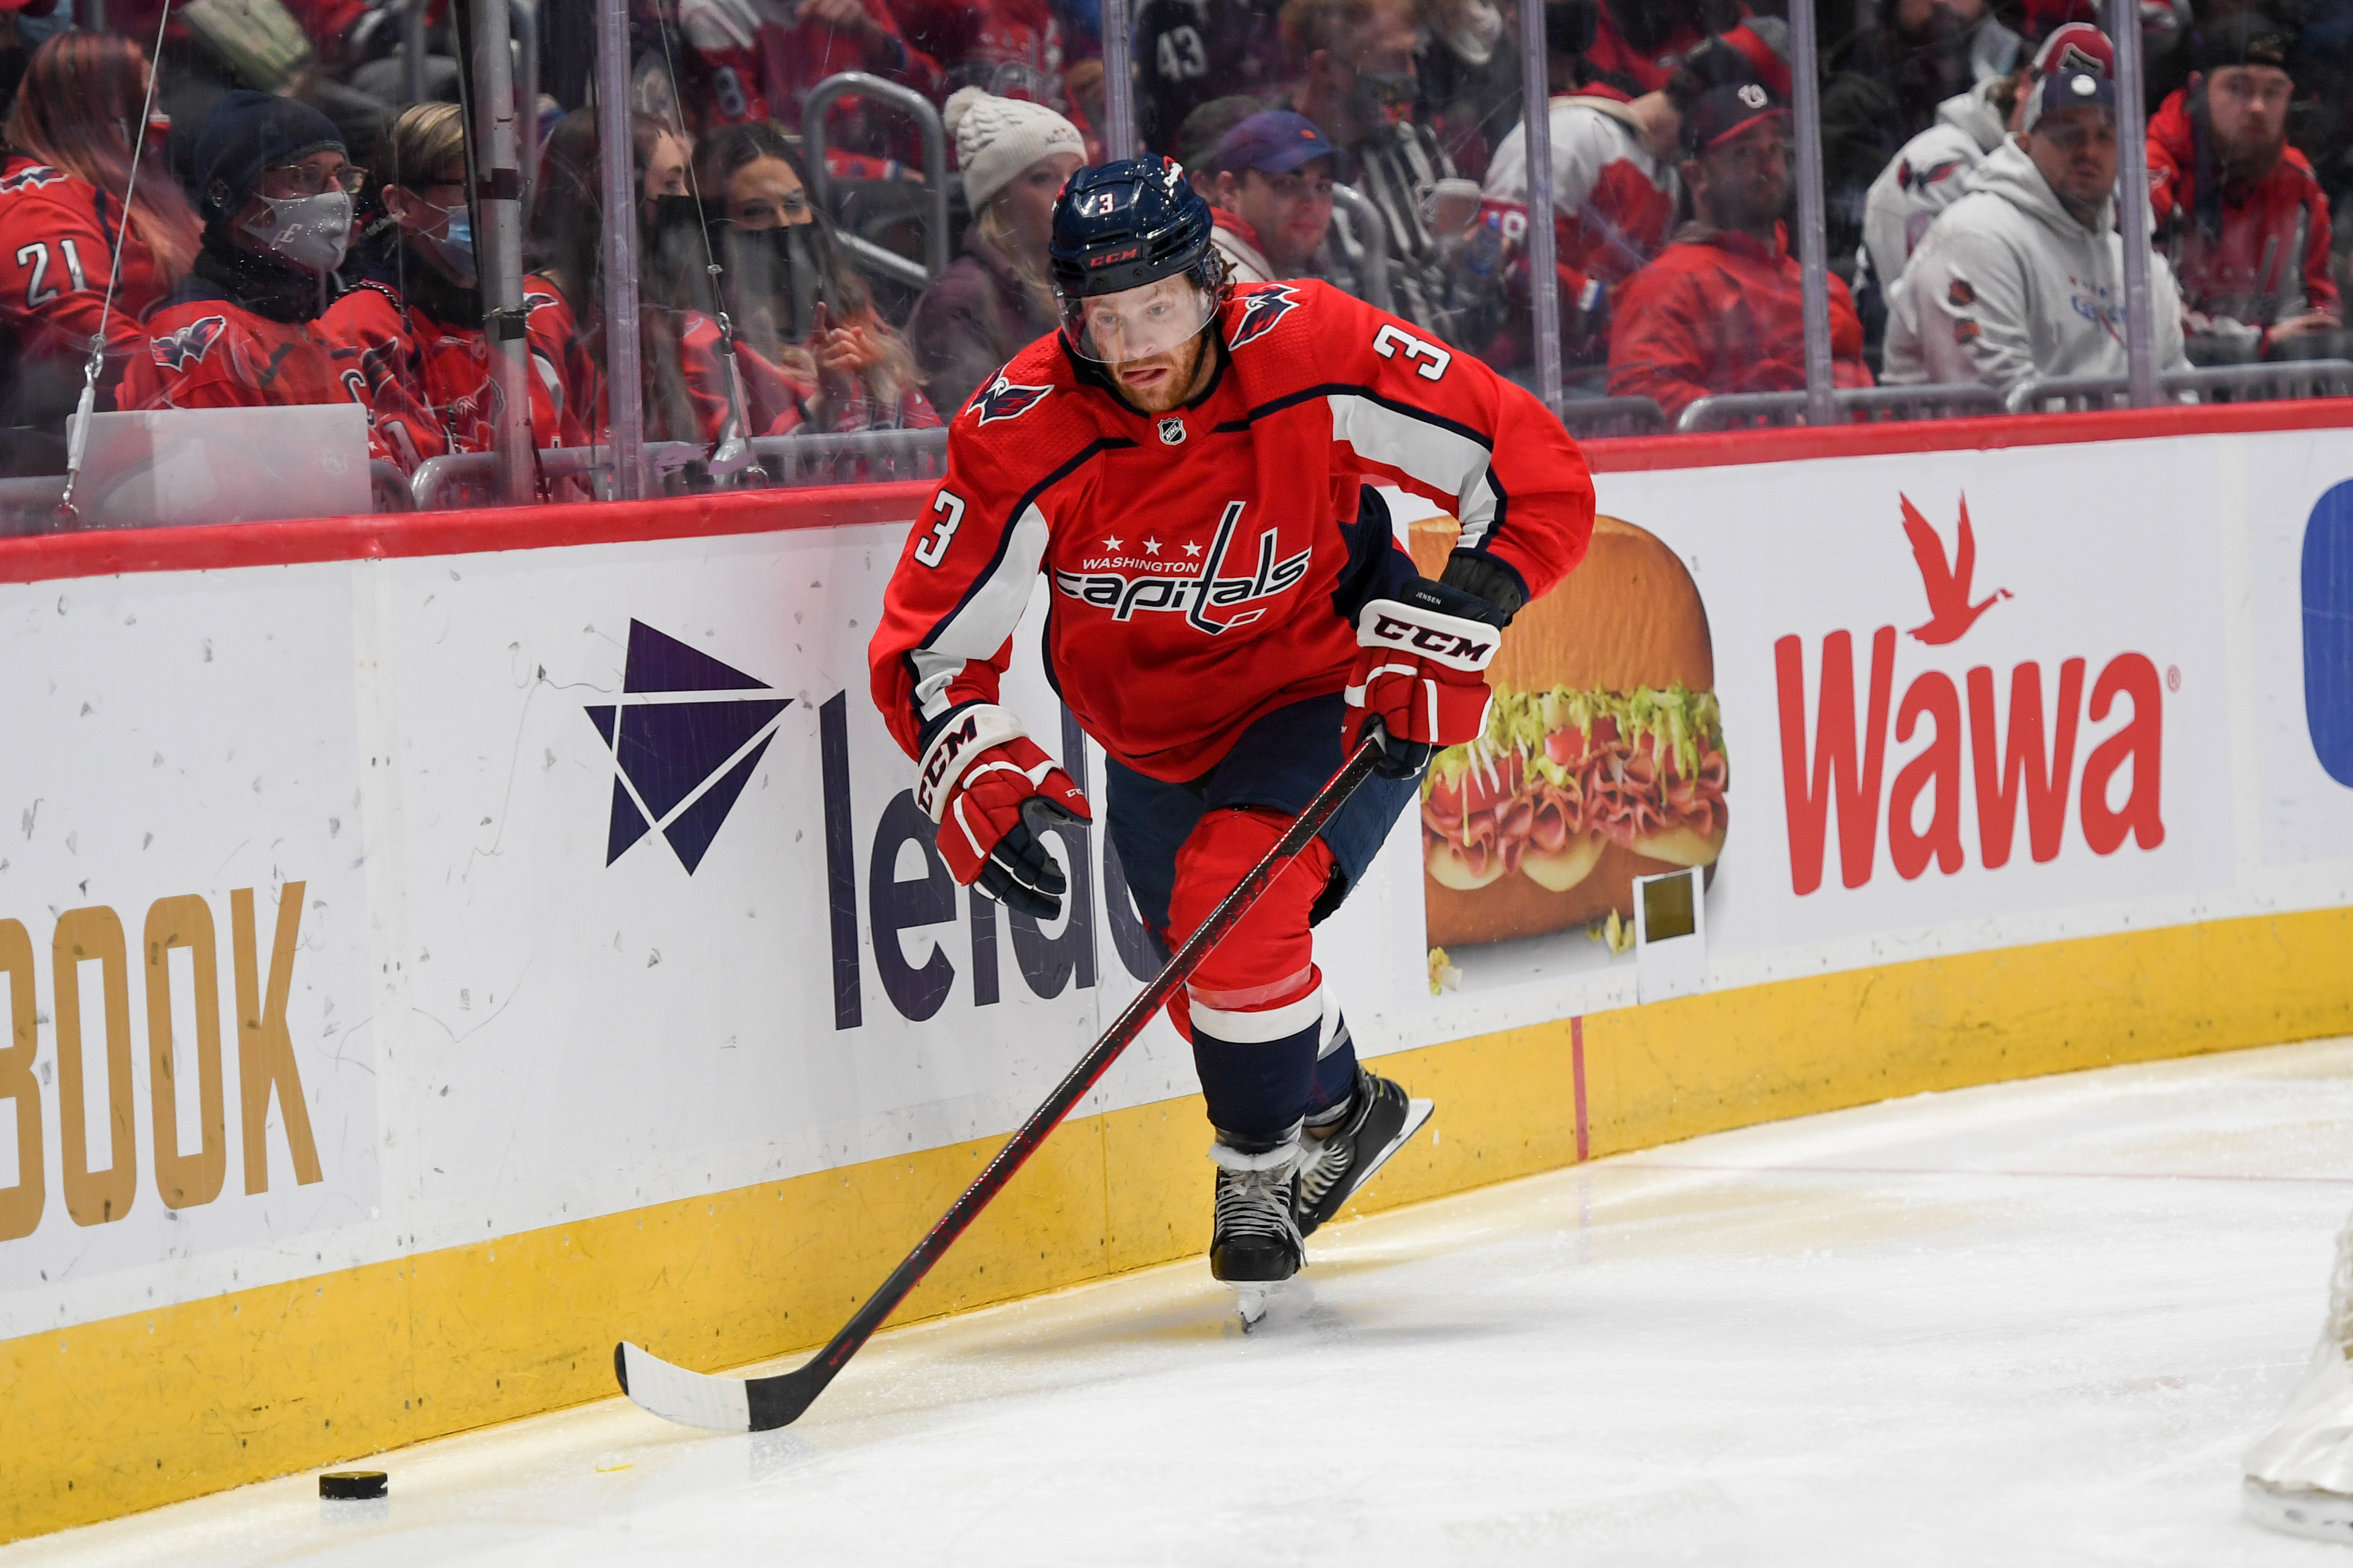
Nick Jensen skating with the puck, Capitals, March 15, 2022
Nick Jensen (Washington Capitals) skating with the puck in the first period against the New York Islanders at Capital One Arena, March 15, 2022.Photo: All-Pro Reels from District of Columbia, USA · CC BY-SA 2.0
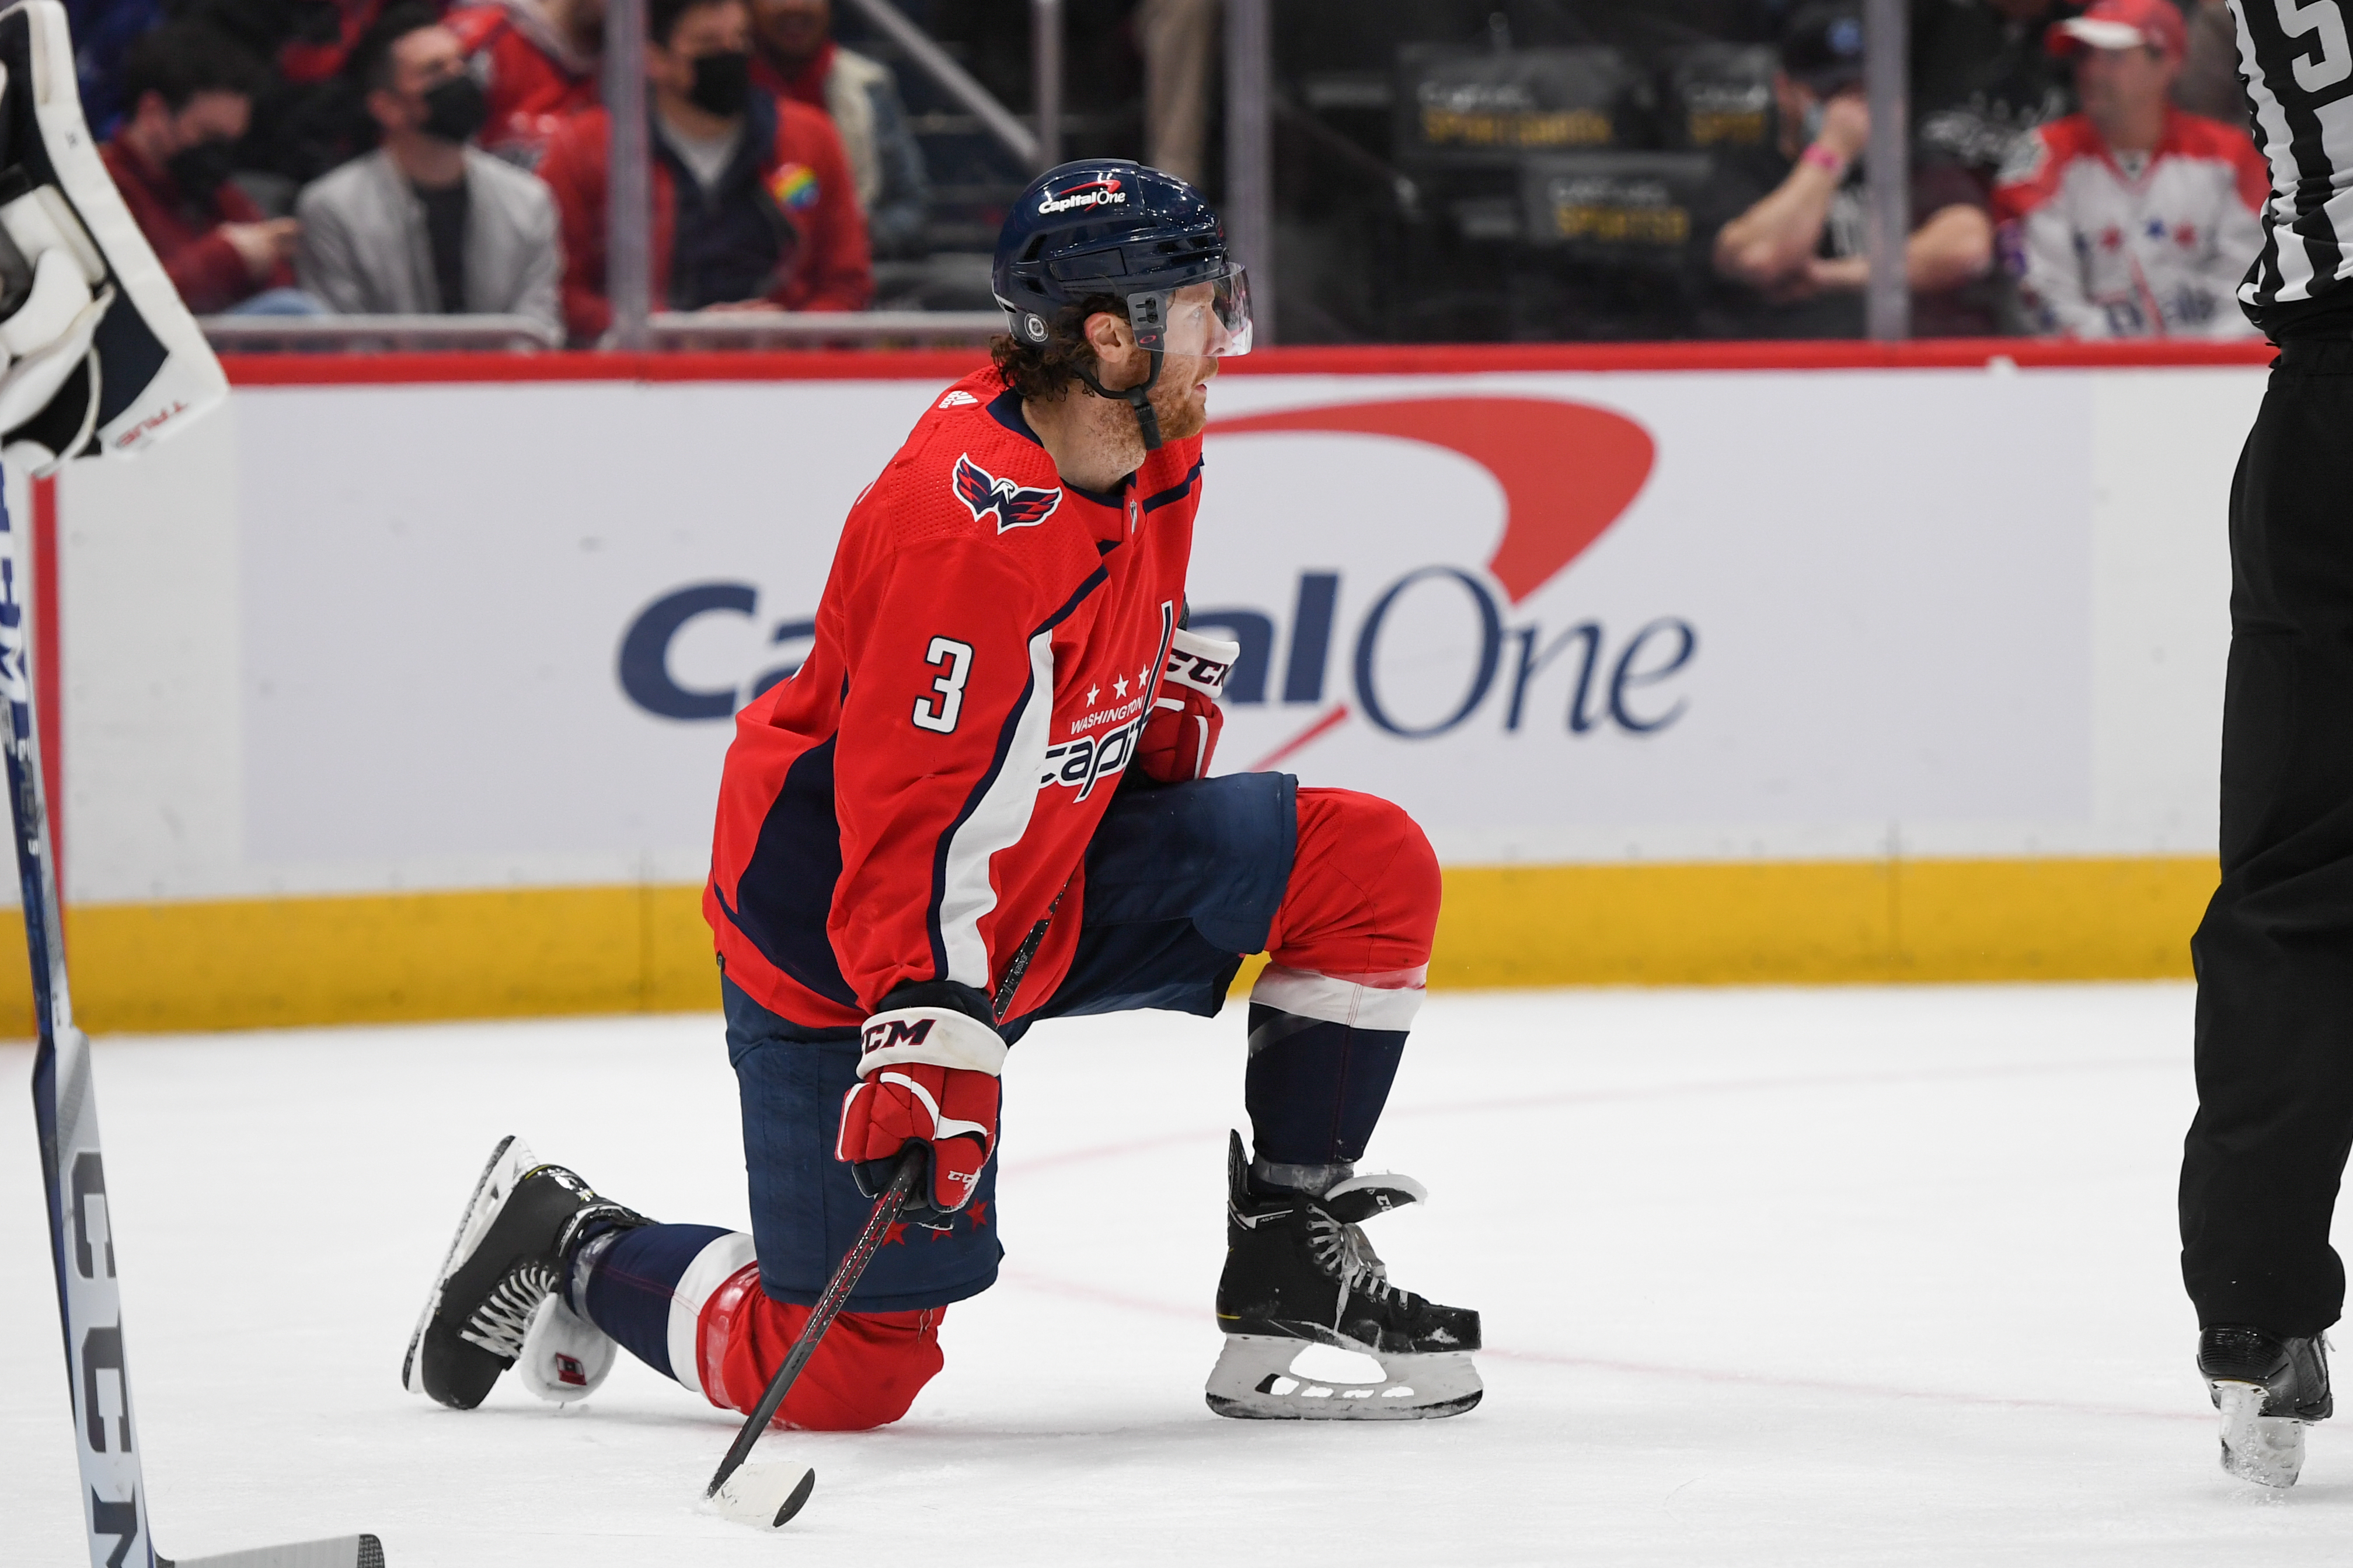
Nick Jensen resting between plays, Capitals vs Blue Jackets, February 8, 2022
Nick Jensen (Washington Capitals) taking a rest during the second period against the Columbus Blue Jackets at Capital One Arena, February 8, 2022.Photo: All-Pro Reels from District of Columbia, USA · CC BY-SA 2.0
Nick Jensen skating behind the net, Capitals vs Blue Jackets, February 8, 2022
Nick Jensen (Washington Capitals) skating toward the puck behind the net during the second period against the Columbus Blue Jackets, February 8, 2022.Photo: All-Pro Reels from District of Columbia, USA · CC BY-SA 2.0
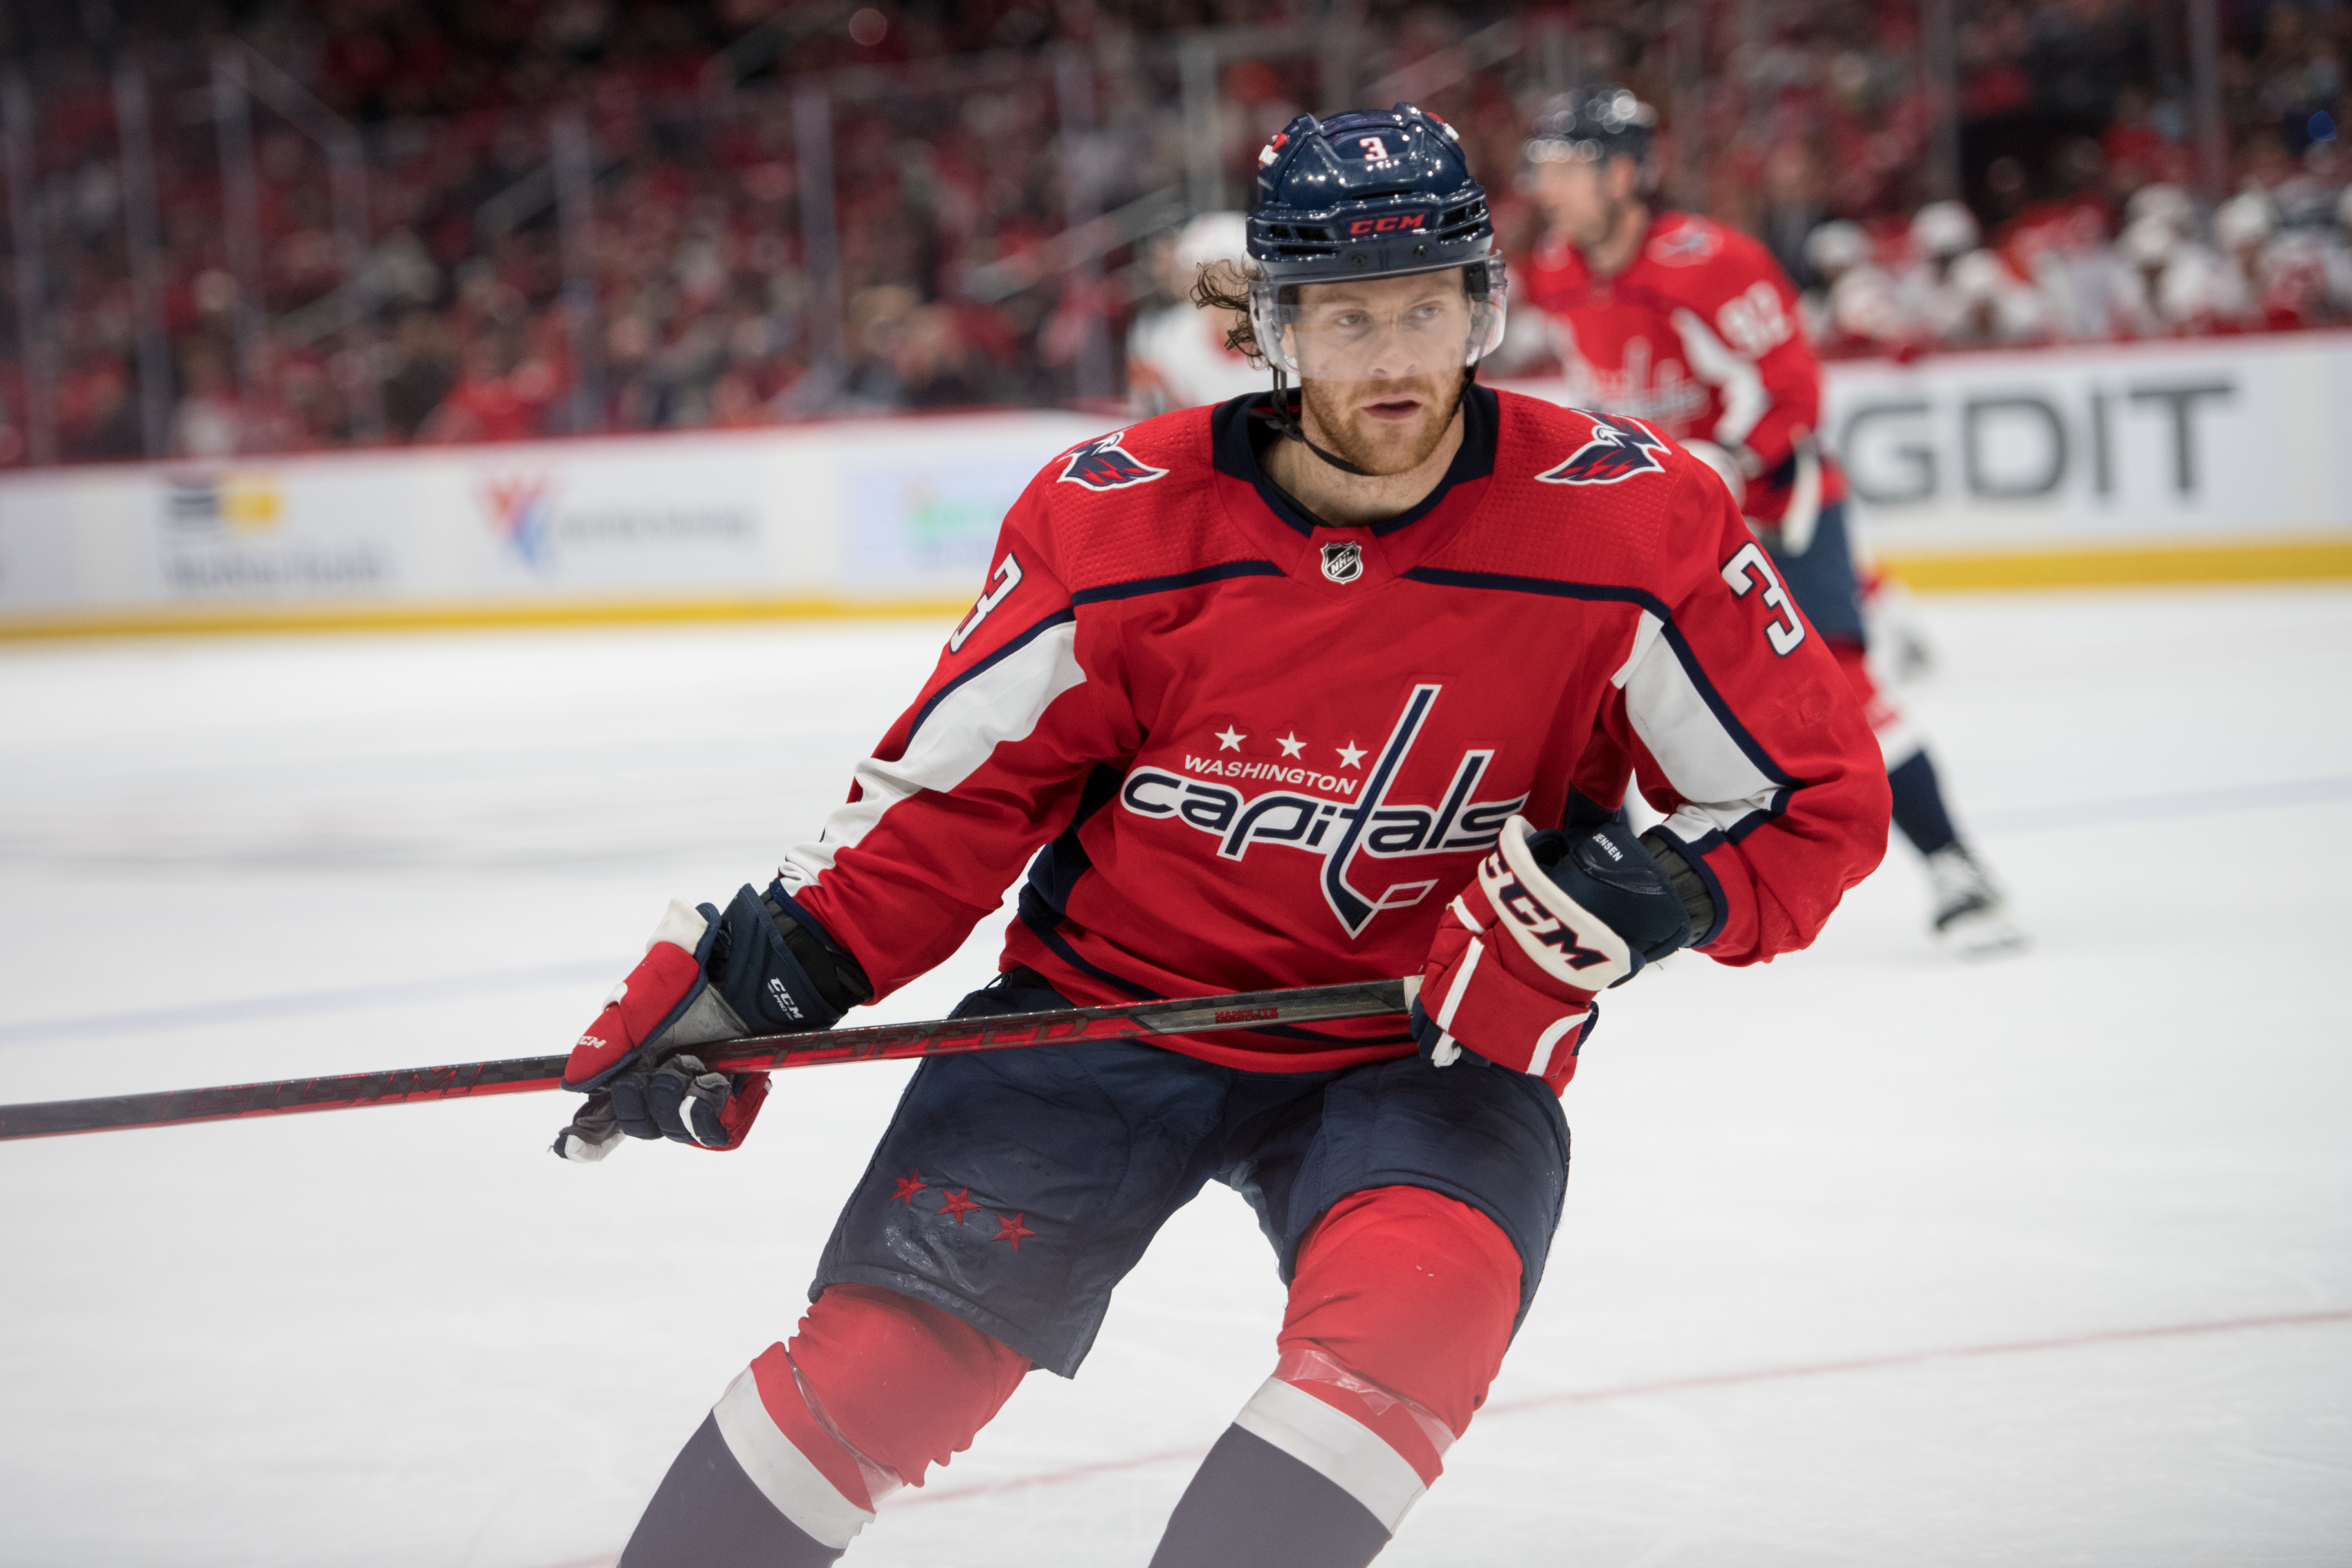
Nick Jensen looking for puck in corner, Capitals vs Red Wings, Oct 27, 2021
Nick Jensen looking for the puck in the corner in the Washington Capitals vs. Red Wings game, October 27, 2021.Photo: All-Pro Reels · CC BY-SA 2.0
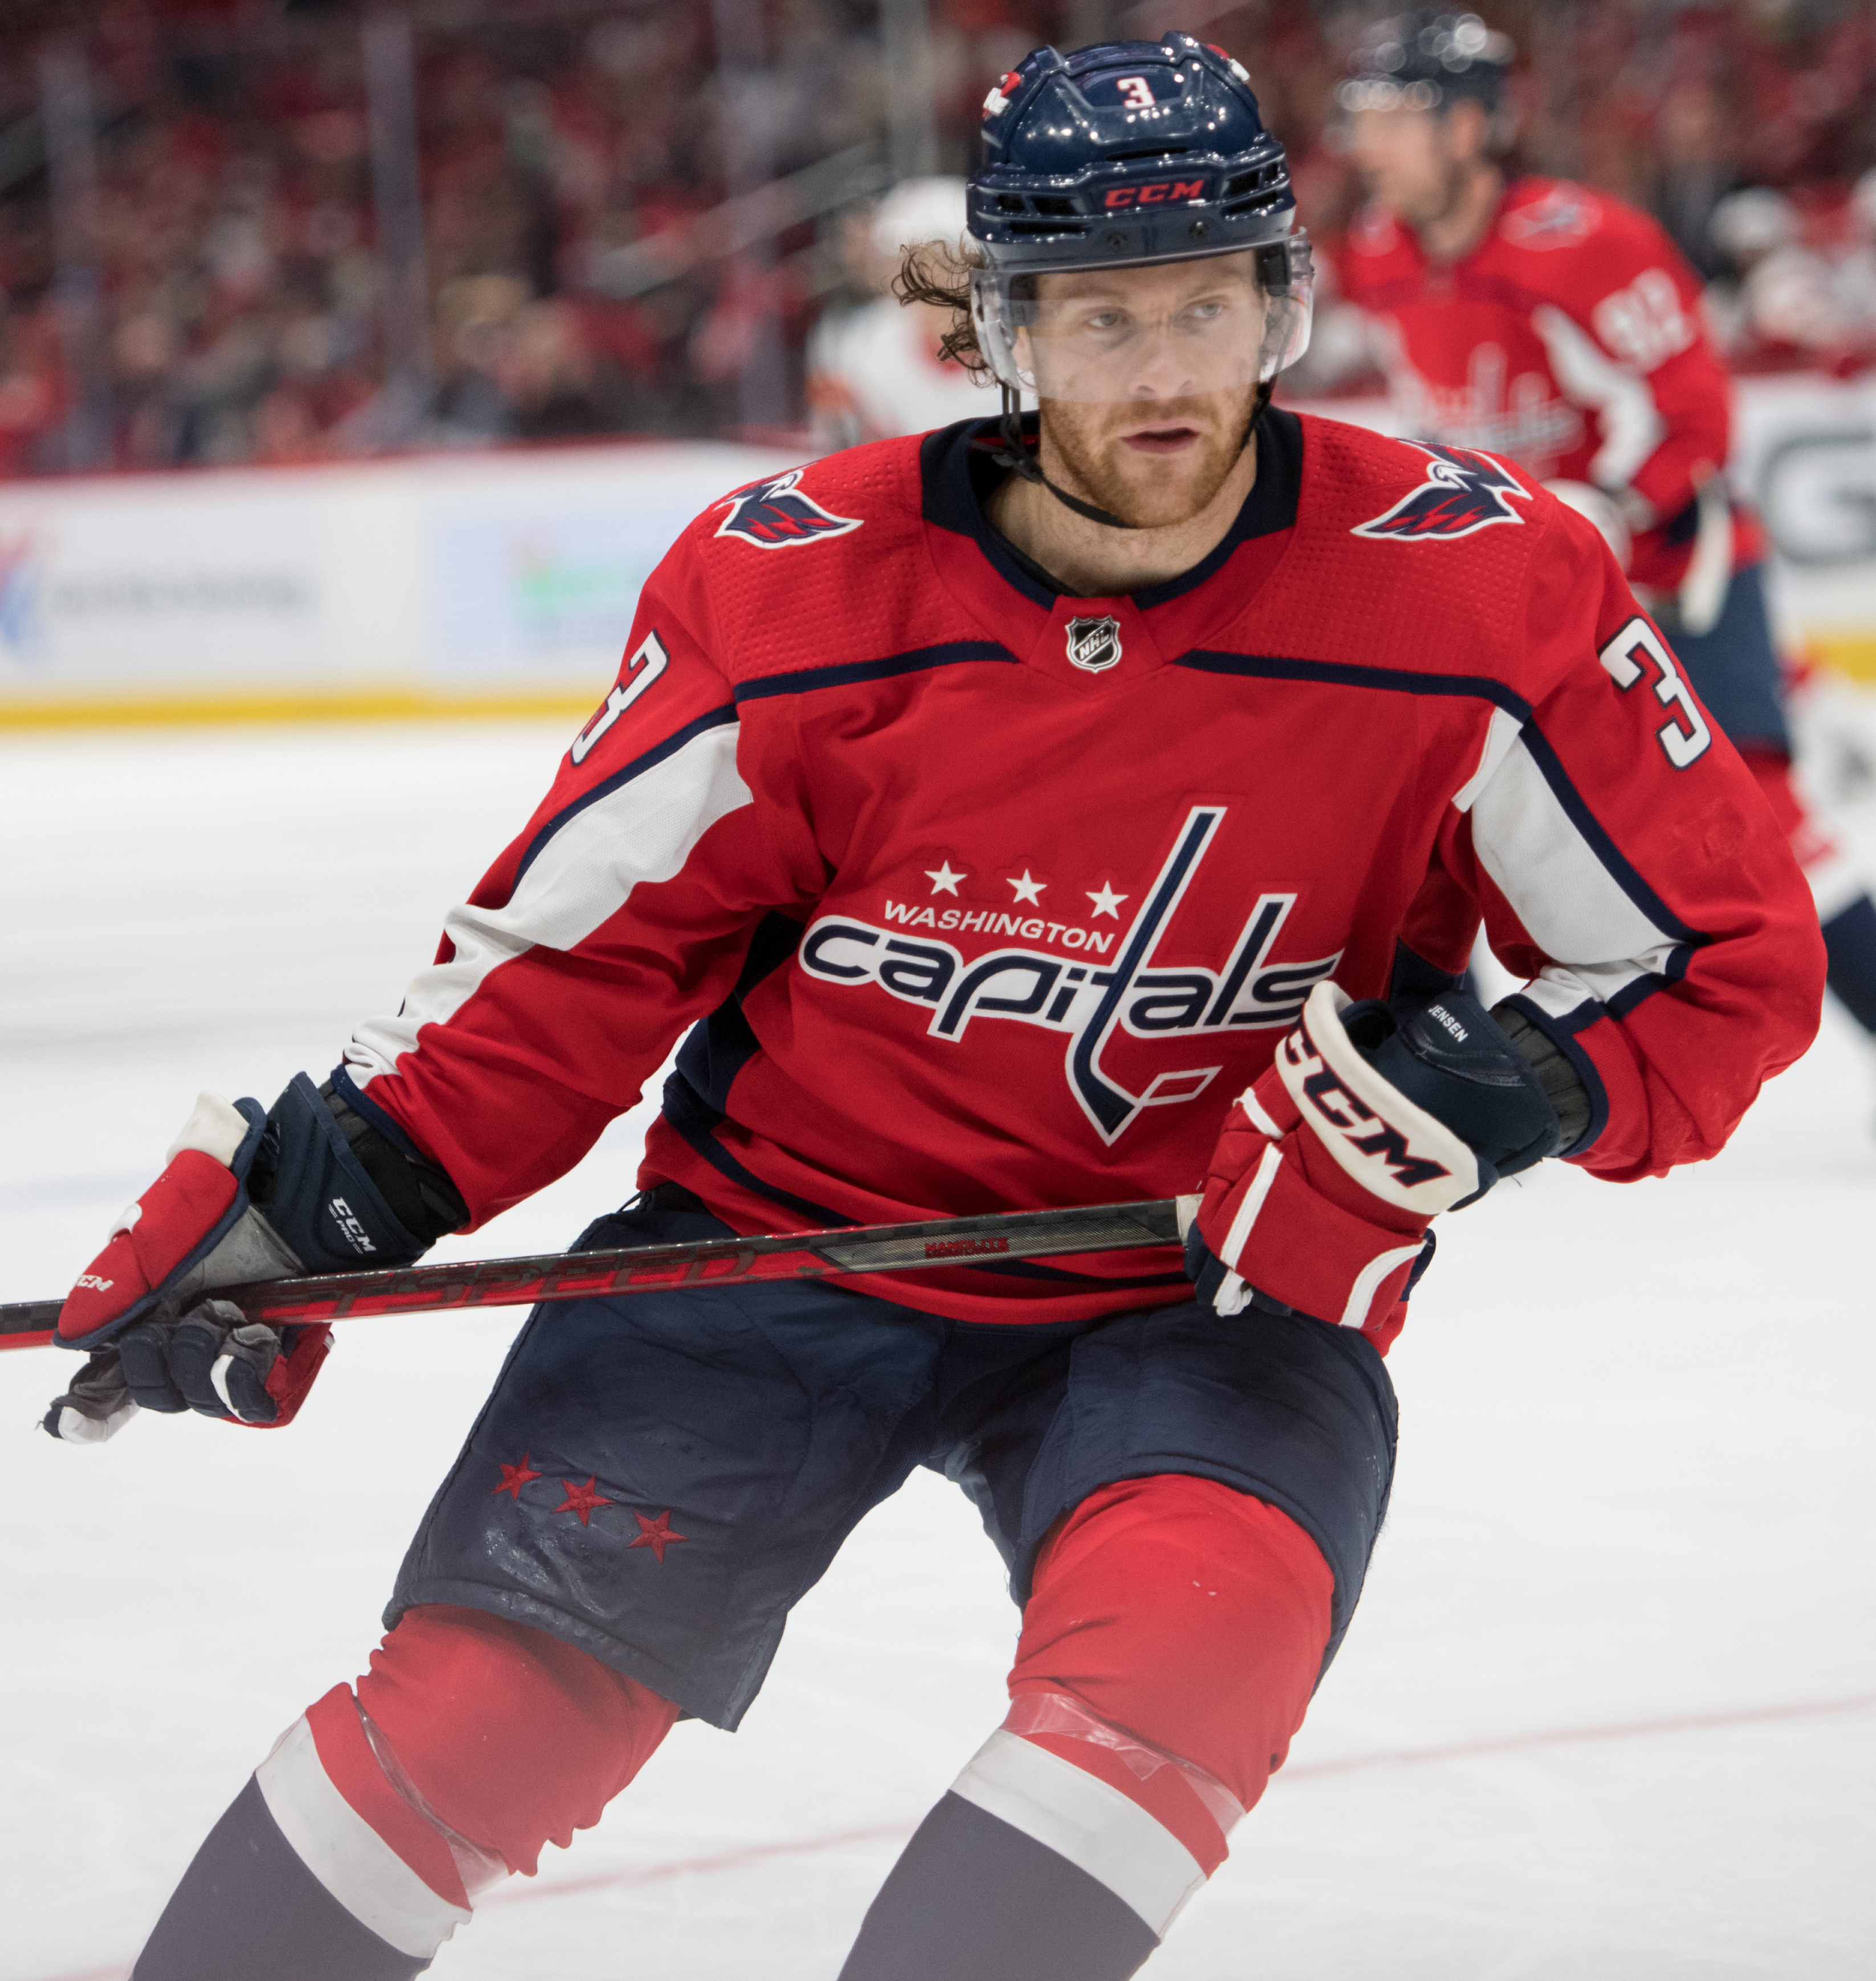
Nick Jensen searching for the puck in a corner (cropped), Oct 27, 2021
Cropped image of Nick Jensen looking for the puck in the corner during the Capitals vs. Red Wings matchup, October 27, 2021.Photo: All-Pro Reels · CC BY-SA 2.0
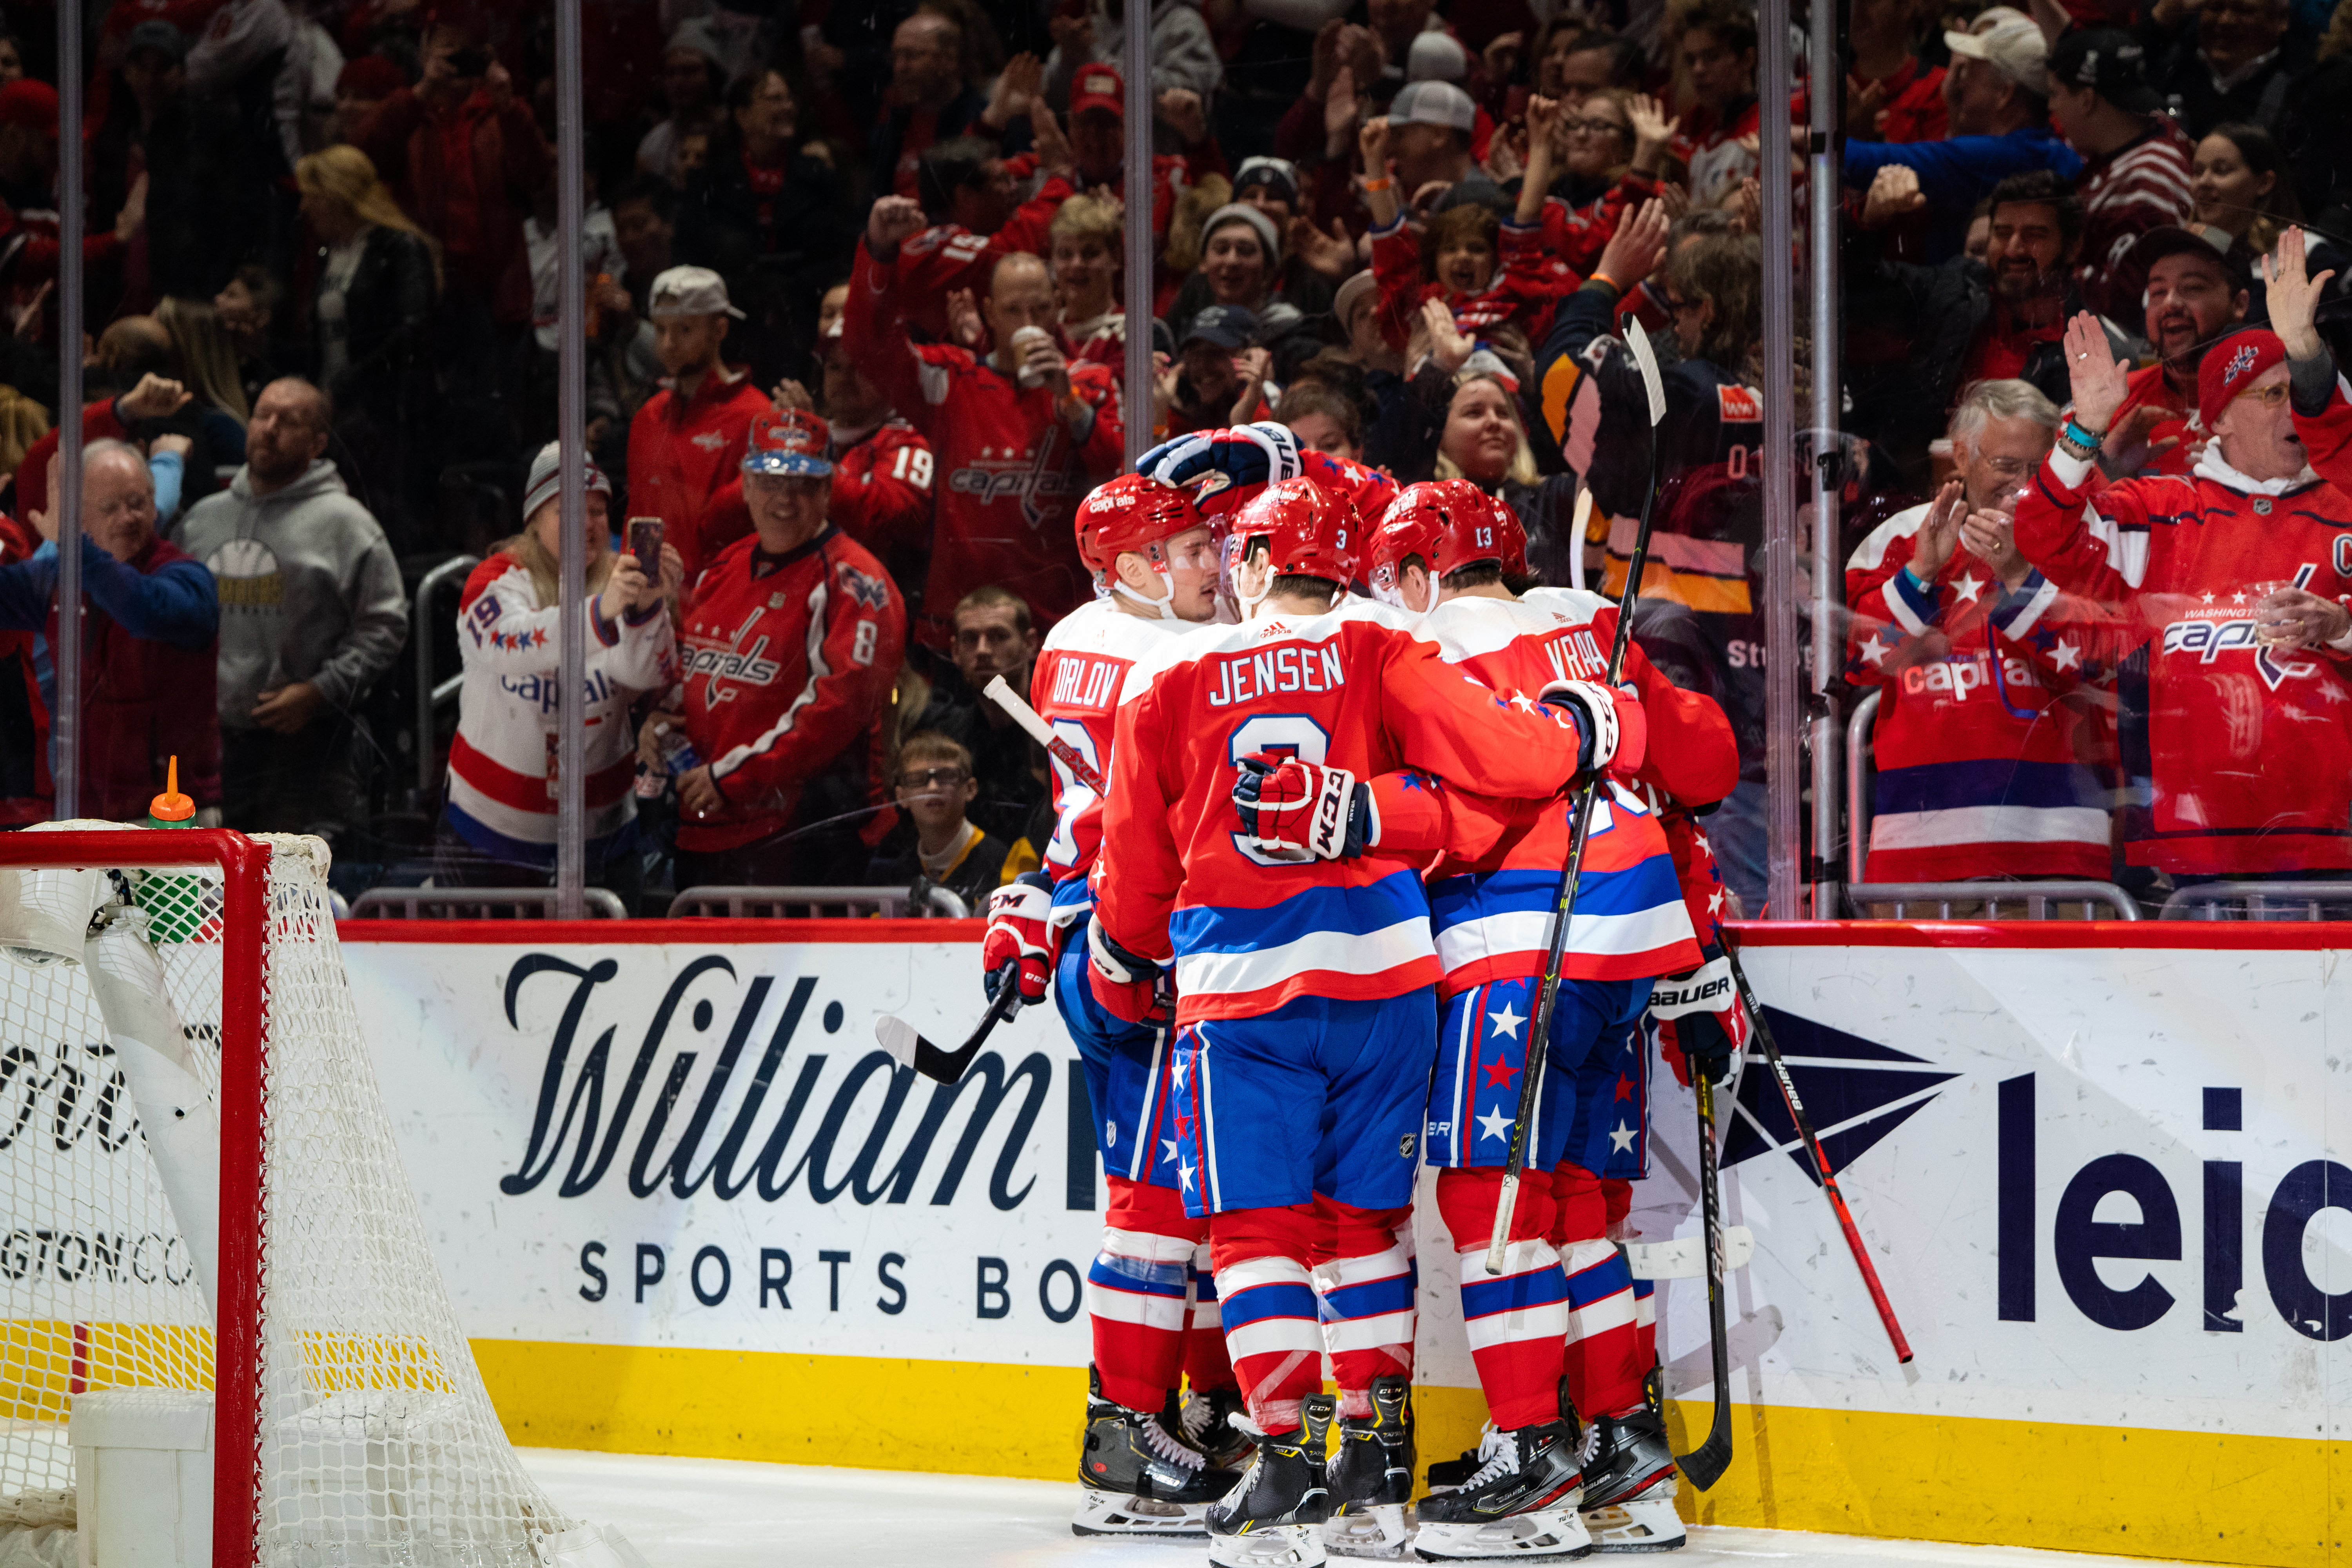
Dmitry Orlov and Nick Jensen goal celebration, Capitals vs Penguins, Feb 2, 2020
Dmitry Orlov and Nick Jensen celebrating a goal in the Washington Capitals vs. Pittsburgh Penguins game, February 2, 2020.Photo: All-Pro Reels from District of Columbia, USA · CC BY-SA 2.0

Facts drawn from Wikipédia, told in our own words.

Advanced stats

TOI/GP
15:20
PP TOI/GP
0:00
SH TOI/GP
0:54
Pts/GP
0.67
EV points
2
Hits
3
Blocks
6
Takeaways
0
Corsi % (SAT)
40.0 %
Off. zone starts
27.3 %

Stats and photos: NHL (NHL.com)

2026-27 projection

Projected points

16between 6 and 25 (80% range)

Goals
5
Assists
11
Games
56

So far: 2 pts in 3 games. The team has played 14 of 84 games. Projected pace: 0.26 pts per game (last season: 0.28).

The projection follows last season's pace. Tested on 2,265 player seasons (2022-23 to 2025-26): average miss of 9 points over 82 games; for players at 0.9 points per game and up, it ran 5 points high on average.

Trend

Slight decline

  • Points per game: 0.18 in 23-24, 0.28 in 25-26
  • PAL Rating: 37 → 23

Outlook, age included

↓ DecliningAge 36: the age when production usually declines

This is only a projection. It knows nothing about injuries, trades or role changes; one player in five finishes outside the range.

Player ratings, 2025-26

All ratings →

Fourteen ratings from 0 to 100 drawn from data, never by hand: 75 = established NHL player, 95+ = elite.

OV · OverallConfidence 84 %

77

Established NHL

SK
Skating
86
Confidence 73 %
ST
Strength
78
Confidence 87 %
EN
Endurance
70
Confidence 80 %
DU
Durability
76
Confidence 77 %
CK
Checking
72
Confidence 87 %
FG
Fighting
62
Confidence 64 %
DI
Discipline
90
Confidence 87 %
FO
Faceoffs
—
PA
Passing
72
Confidence 84 %
SC
Scoring
71
Confidence 84 %
DF
Defense
73
Confidence 82 %
PS
Penalty shot
76
Confidence 0 %
EX
Experience
85
Confidence 100 %
Why these ratings?

SK — Skating86

  • Top speed (35 %)36.2 · 85
  • Bursts > 20 mph /60 (30 %)2.195 · 78
  • Distance /60 (20 %)14.8 · 88
  • Speed consistency (15 %)35.7 · 89

ST — Strength78

  • Contact absorbed /60 (50 %)6.312 · 85
  • Body mass (50 %)-0.14 · 70

EN — Endurance70

  • Ice time per game (45 %)18.5 · 73
  • Total ice time (20 %)1,018 · 69
  • Shift length (15 %)45 · 65
  • Lowest recent ice time per game (15 %)16.9 · 72
  • Special-teams time per game (5 %)1.92 · 68

DU — Durability76

  • Share of games played (100 %)0.822 · 76

CK — Checking72

  • Hits /60 (70 %)2.719 · 72
  • Lowest seasonal rate (20 %)2.404 · 73
  • Season volume (10 %)3.664 · 71

FG — Fighting62

  • Fights per 82 games (100 %)0.684 · 62

DI — Discipline90

  • Net penalty value /60 (50 %)0.007 · 90
  • Penalties taken /60 (30 %)0.338 · 92
  • Penalties drawn /60 (20 %)0.381 · 75

PA — Passing72

  • Primary assists /60 (40 %)0.339 · 72
  • Secondary assists /60 (20 %)0.427 · 76
  • Offensive creation (RAPM) (20 %)-0.052 · 69
  • Power-play points /60 (10 %)3.894 · 68
  • Assist consistency (10 %)0.245 · 76

SC — Scoring71

  • Goals /60 (25 %)0.183 · 70
  • Individual xG /60 (20 %)0.165 · 66
  • Finishing (goals − xG per shot) (20 %)0.271 · 77
  • High-danger chances /60 (15 %)0.111 · 76
  • xG per shot (10 %)0.034 · 70
  • Shot attempts /60 (10 %)8.528 · 66

DF — Defense73

  • RAPM defense /60 (35 %)0.066 · 79
  • Relative xG against (20 %)0.175 · 60
  • On-ice xG against /60 (15 %)2.593 · 76
  • Penalty kill /60 (10 %)-0.066 · 68
  • Takeaways − giveaways /60 (10 %)-2.036 · 74
  • Shot attempts against /60 (5 %)58.4 · 74
  • Blocked shots /60 (5 %)4.3 · 74

PS — Penalty shot76

  • Shootouts (60 %)32.7 · 76
  • Penalty shots (40 %)26.7 · 76

EX — Experience85

  • Career regular-season games (65 %)92
  • Career playoff games (25 %)66
  • NHL seasons (10 %)81

OV — Overall77

  • DF · Defense (30 %)73
  • PA · Passing (22 %)72
  • SK · Skating (12 %)86
  • SC · Scoring (12 %)71
  • EN · Endurance (9 %)70
  • ST · Strength (6 %)78
  • DI · Discipline (5 %)90
  • CK · Checking (4 %)72
Season by season
SeasonOVSKSCDF
2025-2677867173
2024-2578866574
2023-2480896278
2022-2390927284

The bars show confidence (sample size), not player quality. — : not enough data, not a zero. Engine version 1.0.

WAR and PAL ratings, 2025-26

How we rate →

PAL Rating scores performance from 0 to 100 against players at the same position (50 = average player), starting from the player's strength, offensive or defensive. Value Rating compares that performance with what the player costs: 50 means paid what the play is worth.

ProfileLimitedBelow average at both ends

Offense
37
Defense
32
See full details
Offense
55
Creation
9
Shooting
55
Possession
37
Defense
41
Discipline
51
Power play
45
Penalty kill
9

From 0 to 100; 50 is the average player at the same position, adjusted for ice time.

Season by season
SeasonTeamWARPALValue
2025-26OTT0.52317
2024-25OTT0.53724
2023-24WSH0.54424
2022-23WSH1.58073

Wins added to the team, compared with a replacement-level player called up from the AHL.

0.5

wins above replacement

-0.1 to 1.5 — 90% interval

101 of 325 defensemen

+2.7 goals above replacement

Full leaderboard →
See full details
EV offense
-1.6
EV defense
+1.0
Power play
0.0
Penalty kill
-0.2
Shooting
+1.8
Penalties
-0.5
Average → replacement
+2.1

In goals.

Season by season
SeasonTeamGPWARRank
2025-26OTT610.5101/325
2024-25OTT690.590/314
2023-24WSH780.582/316
2022-23WSH771.528/334

Player tracking (NHL EDGE)

League EDGE leaderboards →

Speed, shot power, distance covered, time by zone: measured by chips in the puck and shoulder pads. 90th percentile = better than 90% of players.

Season
Hardest shot
129.1 km/h17th percentileleague avg. 138.6 km/h
Top skating speed
32.2 km/h11th percentileleague avg. 33.9 km/h
Bursts over 20 mph, season
110th percentileleague avg. 7
Offensive zone time
38.8 %18th percentileleague avg. 41.9 %
See full details
Total distance, season
11.3 km10th percentileleague avg. 47.1 km
Distance, single-game high
4.26 km26th percentileleague avg. 4.96 km
Offensive zone at 5v5
39.2 %12th percentileleague avg. 42.4 %
Neutral zone time
18.3 %55th percentileleague avg. 18.3 %
Defensive zone time
42.9 %19th percentileleague avg. 39.7 %

Shooting

Shots on goalGoalsShooting %
All211th percentile178th percentile50.0 %100th percentile
High danger056th percentile085th percentile0.0 %0th percentile
Mid range142nd percentile192nd percentile100.0 %100th percentile
Long range08th percentile082nd percentile0.0 %0th percentile

Shots on goal by zone

Neutral zone : 0 · 85th percentileOutside left : 0 · 54th percentileOutside right : 0 · 60th percentileLeft point : 0 · 36th percentileRight point : 0 · 36th percentileCenter point : 0 · 26th percentileLeft circle : 0 · 49th percentileRight circle : 0 · 58th percentileHigh slot : 1 · 78th percentileLeft of the net : 0 · 87th percentileRight of the net : 0 · 86th percentileLow slot : 0 · 58th percentileCrease : 0 · 93th percentileLeft corner : 0 · 98th percentileBehind the net : 0 · 96th percentileRight corner : 0 · 98th percentile0000000010000000
Beyond the red line : 1

2026-2027 regular season. Measured by puck and player tracking chips; the percentile ranks the player within the league.

Game log, 2026-27

DateOpponentGAPTS+/-
Oct 29vsBuffalo Sabres logoBUF0110
Oct 22@New Jersey Devils logoNJD0000
Oct 19@New York Rangers logoNYR1010

News

Nick Jensen: frequently asked questions

How many goals does Nick Jensen have in 2026-27?

Nick Jensen has 1 goal and 2 points (1 assist) in 3 games in 2026-27.

How old is Nick Jensen?

Nick Jensen is 36 years old: he was born on September 21, 1990.

How tall is Nick Jensen, and how much does he weigh?

Nick Jensen is 6'0" (183 cm) and weighs 201 lb (91 kg).

Where is Nick Jensen from?

United States: Nick Jensen was born in Rogers, Minnesota, United States.

What team does Nick Jensen play for?

Nick Jensen plays for the Anaheim Ducks in the NHL, at D, wearing number 4.

Is Nick Jensen injured?

No: Nick Jensen is not on the latest NHL injury report. This answer is updated throughout the season.

How good is Nick Jensen?

Nick Jensen produced 0.5 wins above replacement (WAR) in 2025-26, 101st of 325 players at his position in the NHL. His PAL rating is 23 out of 100: below average for his position.

How much does Nick Jensen make?

Nick Jensen earns $4.1M for the 2025-26 season. His Value Rating is 17 out of 100 (very poor return): it measures the on-field return for that salary, compared with players at his position.

When does Nick Jensen's contract end?

Nick Jensen's contract runs through the 2027-28 season; he will then be an unrestricted free agent.

Is Nick Jensen overpaid?

Yes, his output falls short of what his salary should buy. His Value rating is 17 out of 100 (very poor return), where 50 is the output expected for his salary, compared with players at his position.

Is Nick Jensen a top-10 player at his position?

No: by WAR, he ranks 101st of 325 players at his position in the NHL in 2025-26. Our comparison tool puts him side by side with any other player.

Is Nick Jensen getting better?

No, he is slipping: his PAL rating went from 37 in 2024-25 to 23 in 2025-26 (out of 100, 50 = average player at his position).

How has Nick Jensen played lately?

Over his last 3 games, Nick Jensen has 2 points (1 goal, 1 assist).

What are Nick Jensen's career stats?

Over his NHL career, Nick Jensen has 697 games, 27 goals, 147 assists and 174 points. His best season: 2022-23, with 29 points in 77 games.

Where was Nick Jensen drafted?

Nick Jensen was drafted 150th overall (round 5) by Detroit Red Wings in 2009.

How does Nick Jensen perform in the playoffs?

In the playoffs, Nick Jensen has 33 games and 0 points in his career. His pace (0.00 points per game) is lower than his regular-season pace (0.25).

Which player is most similar to Nick Jensen?

Cam Fowler: he is the player at his position whose PAL profile (the 0-to-100 dimensions) is closest to his in 2025-26.

Cam Fowler's page →

Is Nick Jensen a good fantasy pick?

Probably not, except in deep leagues: our projection has him at 16 points in 2026-27, or 0.29 points per game.

Is Nick Jensen related to anyone famous?

Yes: Jeff Jensen (father, played college hockey at Lake Superior State and was a Colorado Rockies draft pick); Steve Jensen (uncle, played for the Minnesota North Stars and Los Angeles Kings and was an Olympian with Team USA in 1976).

Is Nick Jensen married?

Yes, married to Jenner.

What is Nick Jensen's nationality?

Nick Jensen is American. Internationally: United States — 2018 IIHF World Championship: bronze medal (1 goal, 3 assists in 10 games).

What awards has Nick Jensen won?

USHL All-Star (2010) ; WHCA Third Team All‑Star (2011–12) ; WCHA Defensive Player of the Year (2012–13) ; NCAA West First All‑American Team (2012–13).

How many championships has Nick Jensen won?

2: Clark Cup — Green Bay Gamblers (champions 2009–10); NCAA Midwest Regional — St. Cloud State (champions 2012–13).

Where did Nick Jensen play before turning pro?

Rogers Royals (Minnesota State High School League, two seasons), Green Bay Gamblers (USHL, 2008–09 and 2009–10), St. Cloud State Huskies (NCAA WCHA, 2010–13).

How many points is Nick Jensen projected to score in 2026-27?

Our projection has him at 16 points in 56 games in 2026-27 (6 to 25 points, 80% interval), based on his recent seasons, age and role.


See also: his Anaheim Ducks teammates

Full roster →

NHL.com ↗ · Stats and photos: NHL (NHL.com)