

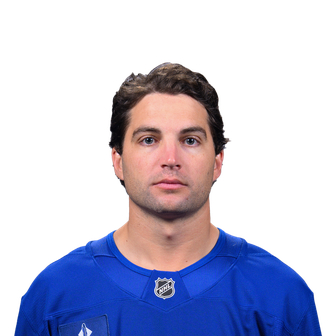
Conor
Sheary
L · BUF · Balanced · Below average
- PAL
- 23
- WAR
- 0.1
- Value
- 40
- PTS
- 18
2025-26№ 319 / 615
Conor Sheary (Buffalo Sabres) stats and profile: offensive production, ice time, advanced stats, WAR and PAL rating.
Conor Sheary
#43LPlays: Left wing · 4% of faceoffs Buffalo Sabres
HEIGHT : 173 cm · WEIGHT : 83 kg · SHOOTS : L
Born : June 7, 1992 · Winchester, United States
Contract : $850,000 · 2026-27 → 2026-27 · Standard Contract · UFA
NHL record
| Year | Team | GP | G | A | PTS | PIM |
|---|---|---|---|---|---|---|
| 2025-26 | New York Rangers | 62 | 7 | 11 | 18 | 14 |
| 2024-25 | Tampa Bay Lightning | 5 | 0 | 0 | 0 | 4 |
| 2023-24 | Tampa Bay Lightning | 57 | 4 | 11 | 15 | 12 |
| 2022-23 | Washington Capitals | 82 | 15 | 22 | 37 | 22 |
| 2021-22 | Washington Capitals | 71 | 19 | 24 | 43 | 14 |
| 2020-21 | Washington Capitals | 53 | 14 | 8 | 22 | 14 |
| 2019-20 | Pittsburgh Penguins | 8 | 1 | 3 | 4 | 2 |
| 2019-20 | Buffalo Sabres | 55 | 9 | 10 | 19 | 8 |
| 2018-19 | Buffalo Sabres | 78 | 14 | 20 | 34 | 12 |
| 2017-18 | Pittsburgh Penguins | 79 | 18 | 12 | 30 | 10 |
| 2016-17 | Pittsburgh Penguins | 61 | 23 | 30 | 53 | 22 |
| 2015-16 | Pittsburgh Penguins | 44 | 7 | 3 | 10 | 8 |
| NHL totals | 655 | 131 | 154 | 285 | 142 | |
Playoffs
| Year | Team | GP | G | A | PTS | PIM |
|---|---|---|---|---|---|---|
| 2021-22 | Washington Capitals | 6 | 0 | 1 | 1 | 0 |
| 2020-21 | Washington Capitals | 5 | 1 | 0 | 1 | 2 |
| 2019-20 | Pittsburgh Penguins | 4 | 0 | 2 | 2 | 2 |
| 2017-18 | Pittsburgh Penguins | 12 | 0 | 2 | 2 | 2 |
| 2016-17 | Pittsburgh Penguins | 22 | 2 | 5 | 7 | 4 |
| 2015-16 | Pittsburgh Penguins | 23 | 4 | 6 | 10 | 8 |
| Playoff totals | 72 | 7 | 16 | 23 | 18 | |
Honours
- 🏆 Stanley Cup2 times · 2016-17, 2015-16
Conor Sheary: our analysis
2025-26 season: 62 GP, 7 G, 11 A, 18 PTS, +1 +/-, 14:06 TOI. WAR 0.1 (319th of 615) · PAL 23, below average.
In 2025-26, Conor Sheary, 34, posts a PAL Rating of 23 out of 100 (below average), and his WAR of 0.1 ranks 319th among 615 regulars, in the bottom half.
His strengths: discipline (69, above average). On the other hand, penalty kill (10, among the weakest in the league) and power play (11, among the weakest in the league) hold him back.
Breaking down his WAR (goals above average), his biggest contribution: penalties (+0.7); his biggest cost: finishing (-2.1).
An improvement on 2023-24, when his PAL was 18; his WAR went from -0.1 to 0.1.
Contract-wise, his Value score of 40 (poor return) weighs his output against what he costs: 50 is what that salary should buy.
Conor Sheary's story
Growing up in Melrose, Massachusetts, Conor Sheary finished his collegiate career at UMass Amherst as the team's captain in his senior year, playing all 34 games and leading the Minutemen with 28 points. His four seasons in Amherst culminated in surpassing 100 career points and leaving school among the program's top all‑time scorers.
Undrafted out of college, Sheary left UMass at the end of 2013–14 and joined the Wilkes‑Barre/Scranton Penguins on a tryout to close that AHL season. He stayed through the playoffs, impressed with his production, and after a 2014–15 campaign that made him his AHL club's leading scorer, he signed a two‑year entry‑level NHL deal with Pittsburgh.
Sheary made his NHL debut in December 2015 against Boston and registered his first NHL goal and assist two days later. Thrust into meaningful minutes, he supplied key contributions in the 2016 postseason — including his first playoff goal and an overtime game‑winner in the Stanley Cup Final — helping Pittsburgh capture the Cup. The following season he played alongside Sidney Crosby, posted 23 goals and 53 points, and earned a second straight Stanley Cup ring.
Pittsburgh traded him to Buffalo in June 2018, where he settled into a top‑nine forward role and produced 34 points in 2018–19. A midseason return to Pittsburgh came in 2020, followed by contracts with Washington and Tampa Bay and assignments between the NHL and AHL. He later signed a one‑year deal with the Rangers for 2025–26 and then returned to the Sabres on a one‑year contract in July 2026.
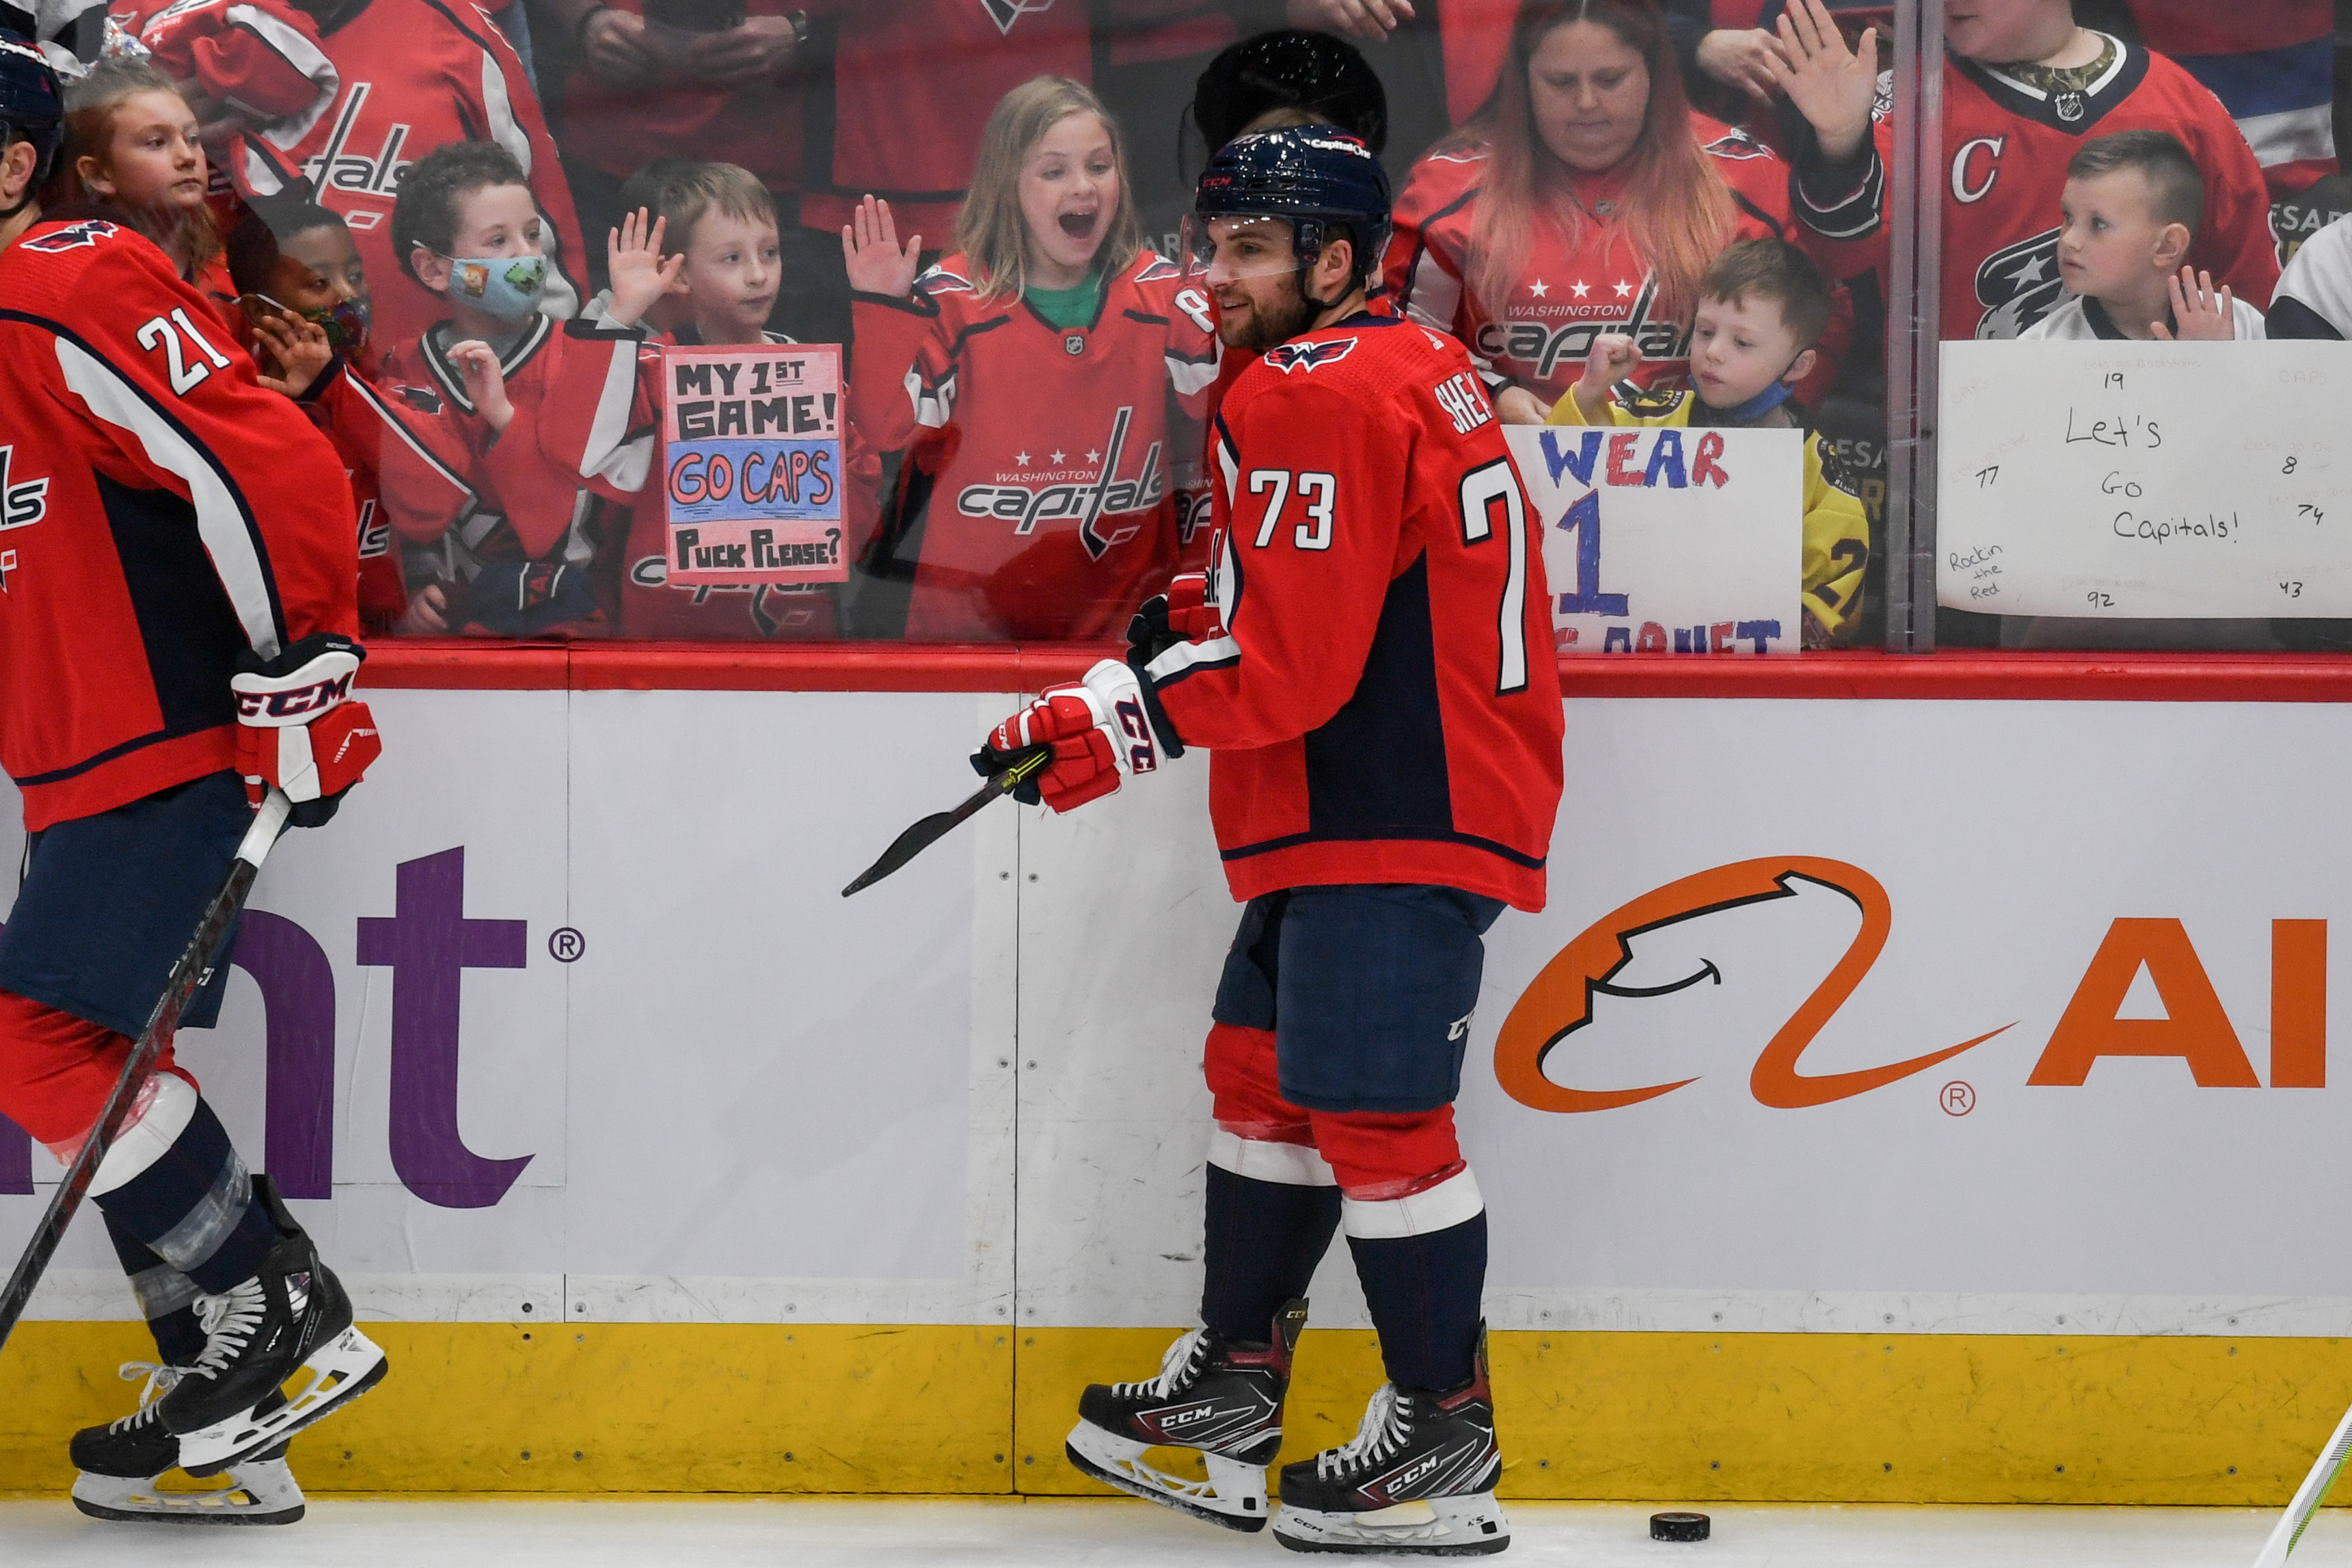
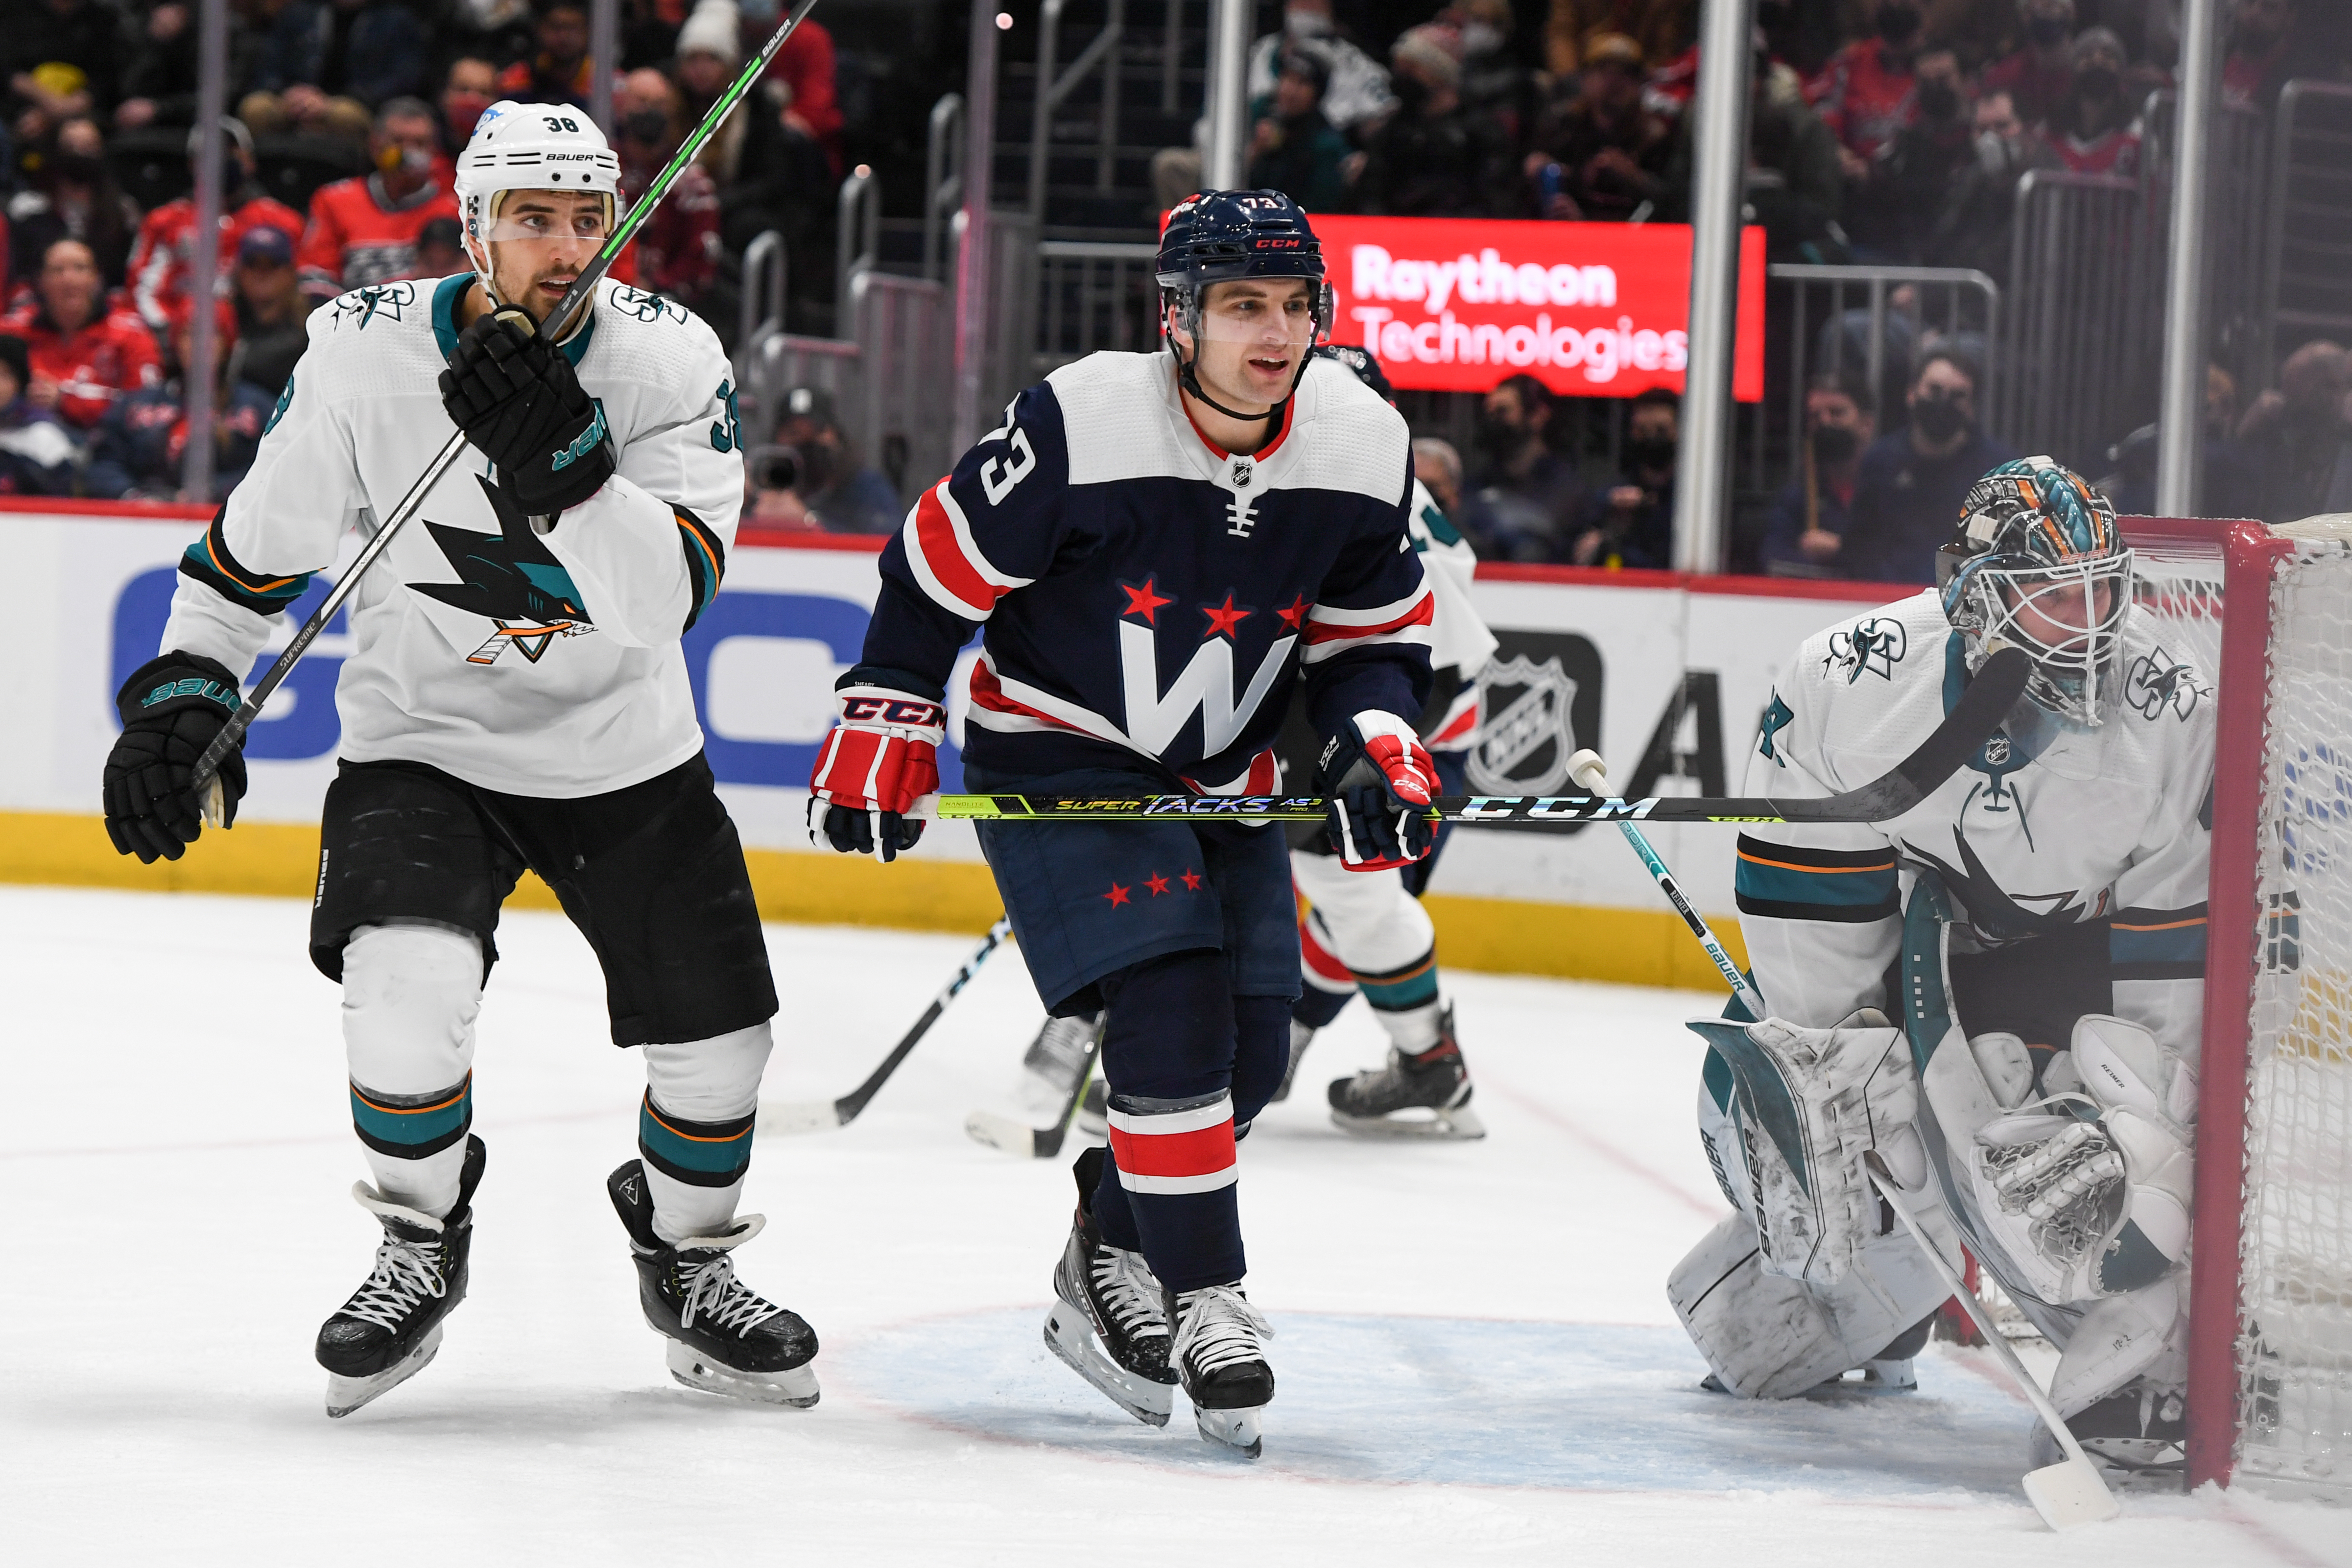
Sheary's game is defined by his quick adjustment to new linemates and his knack for creating chances in tight spaces. Not a large player, he compensates with mobility, an eye for the net on tip‑ins and rebounds, and a willingness to play in traffic — traits that proved especially valuable during Pittsburgh's Cup runs.
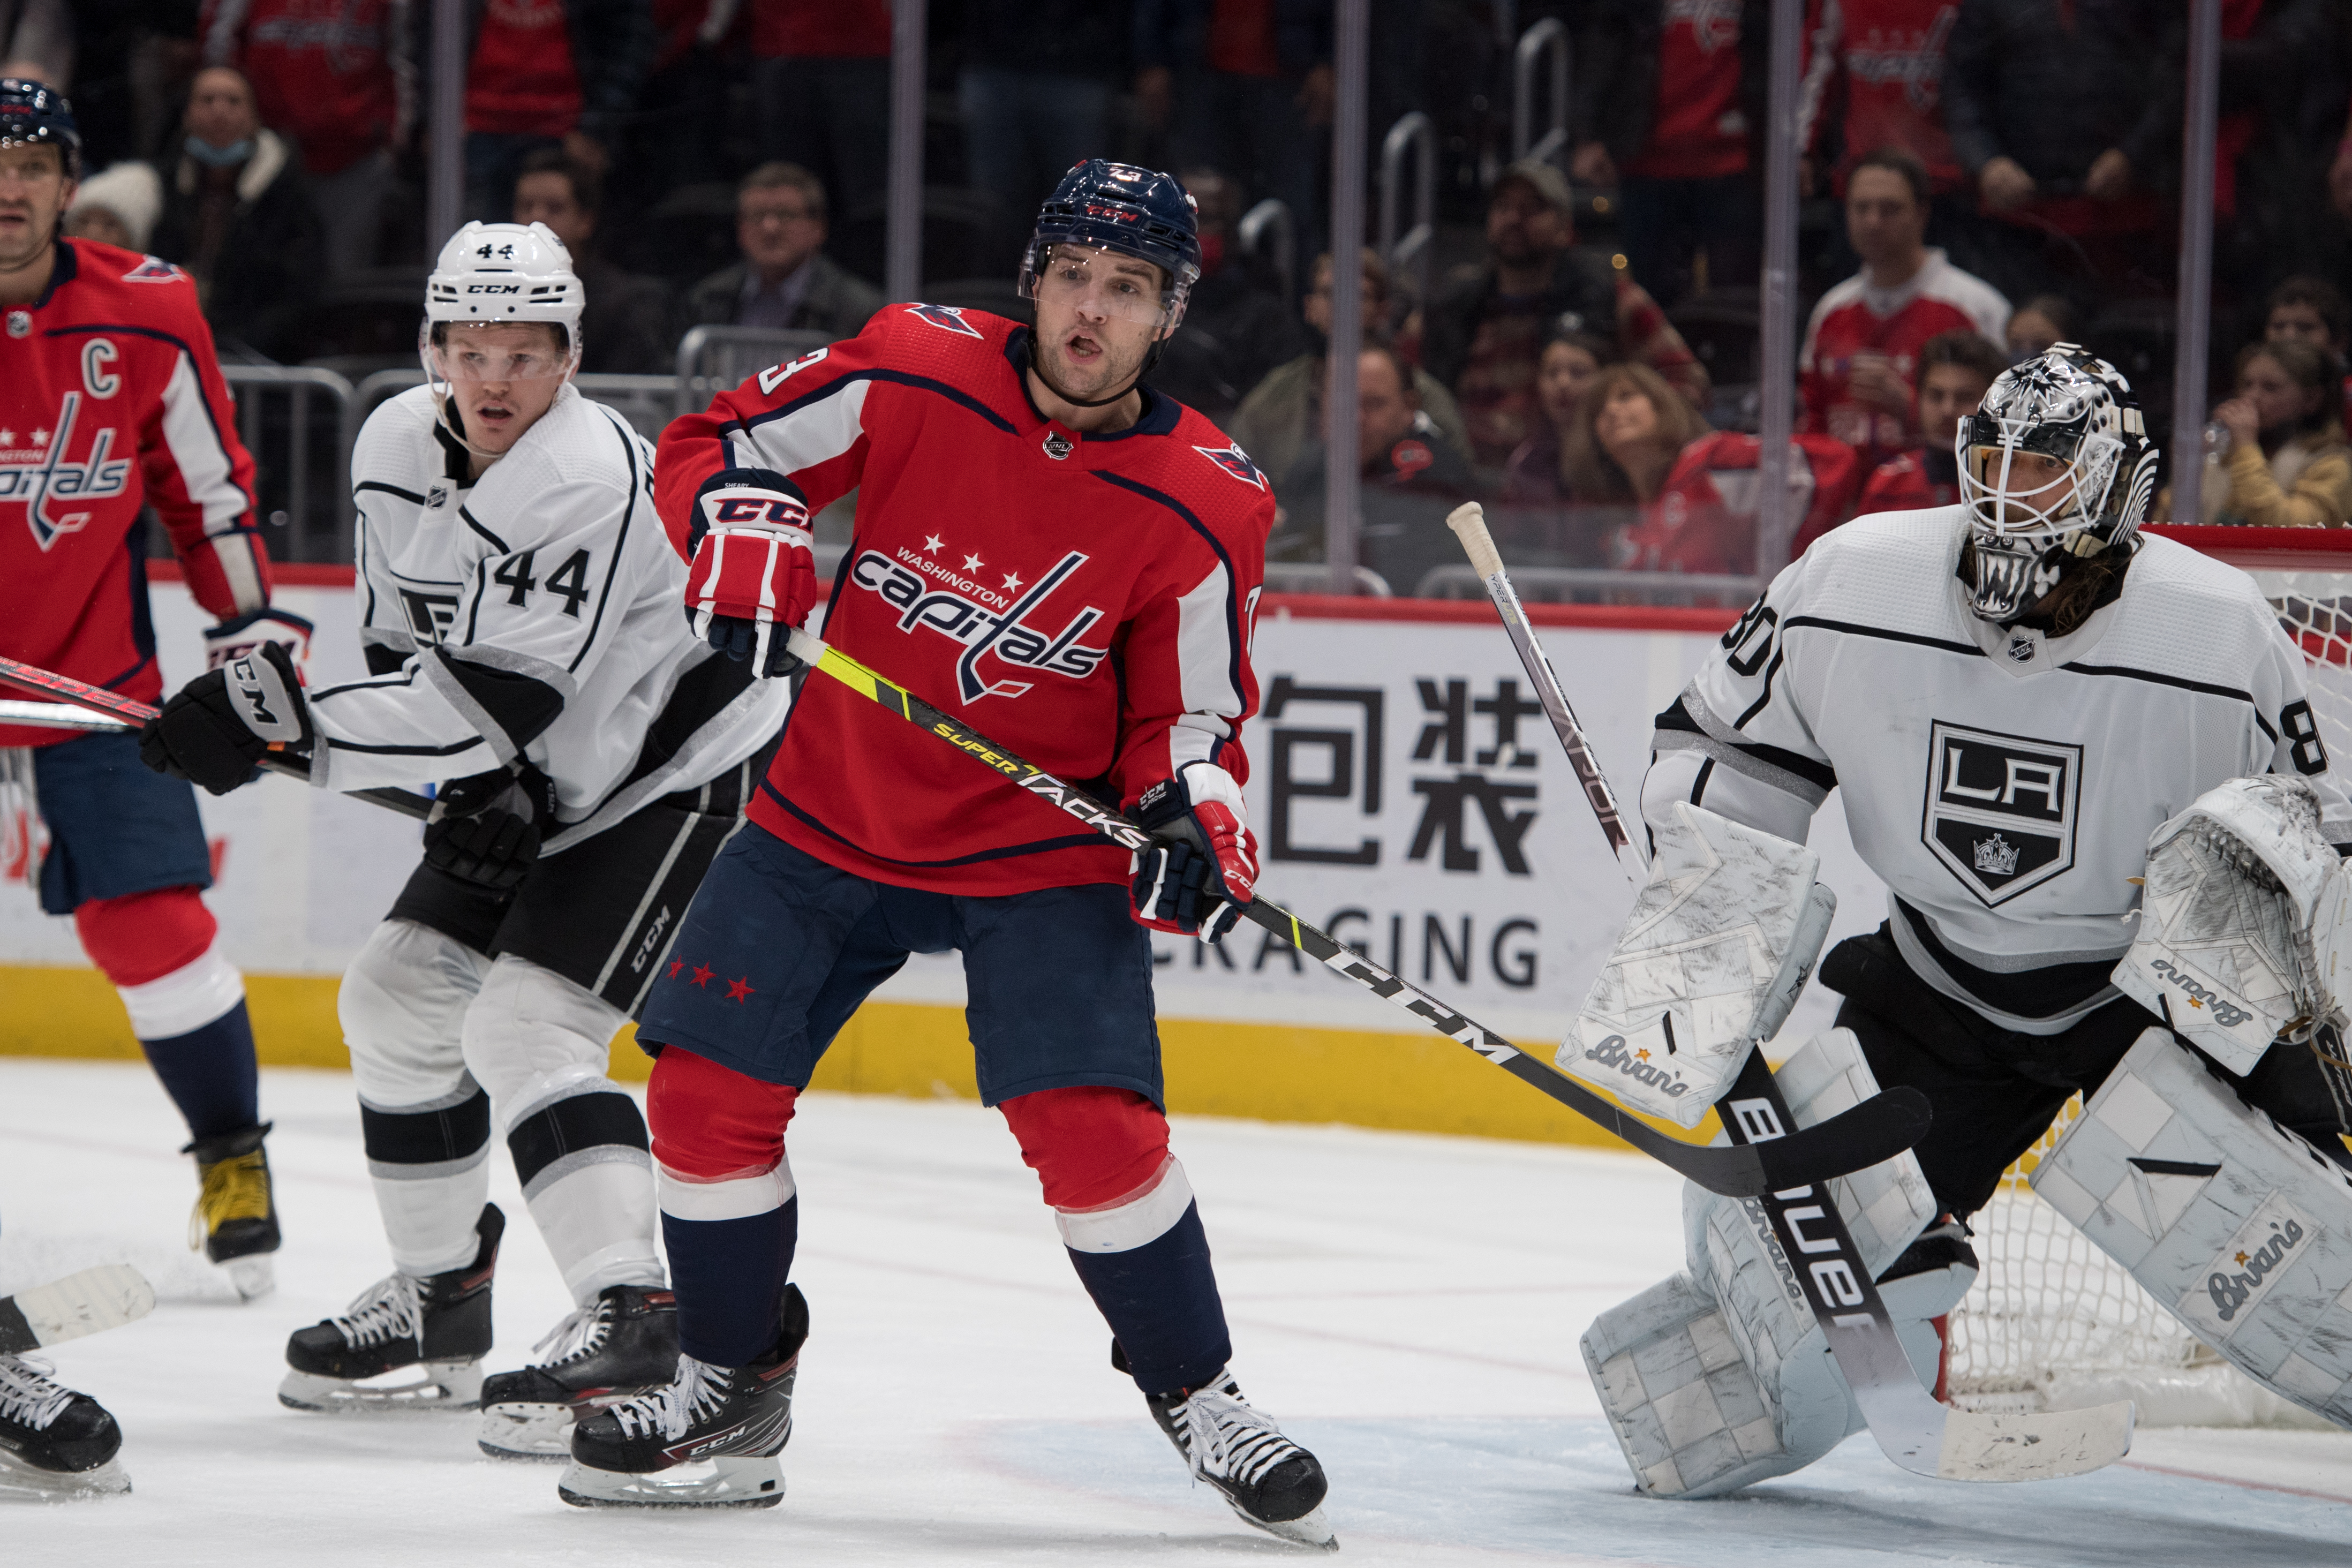
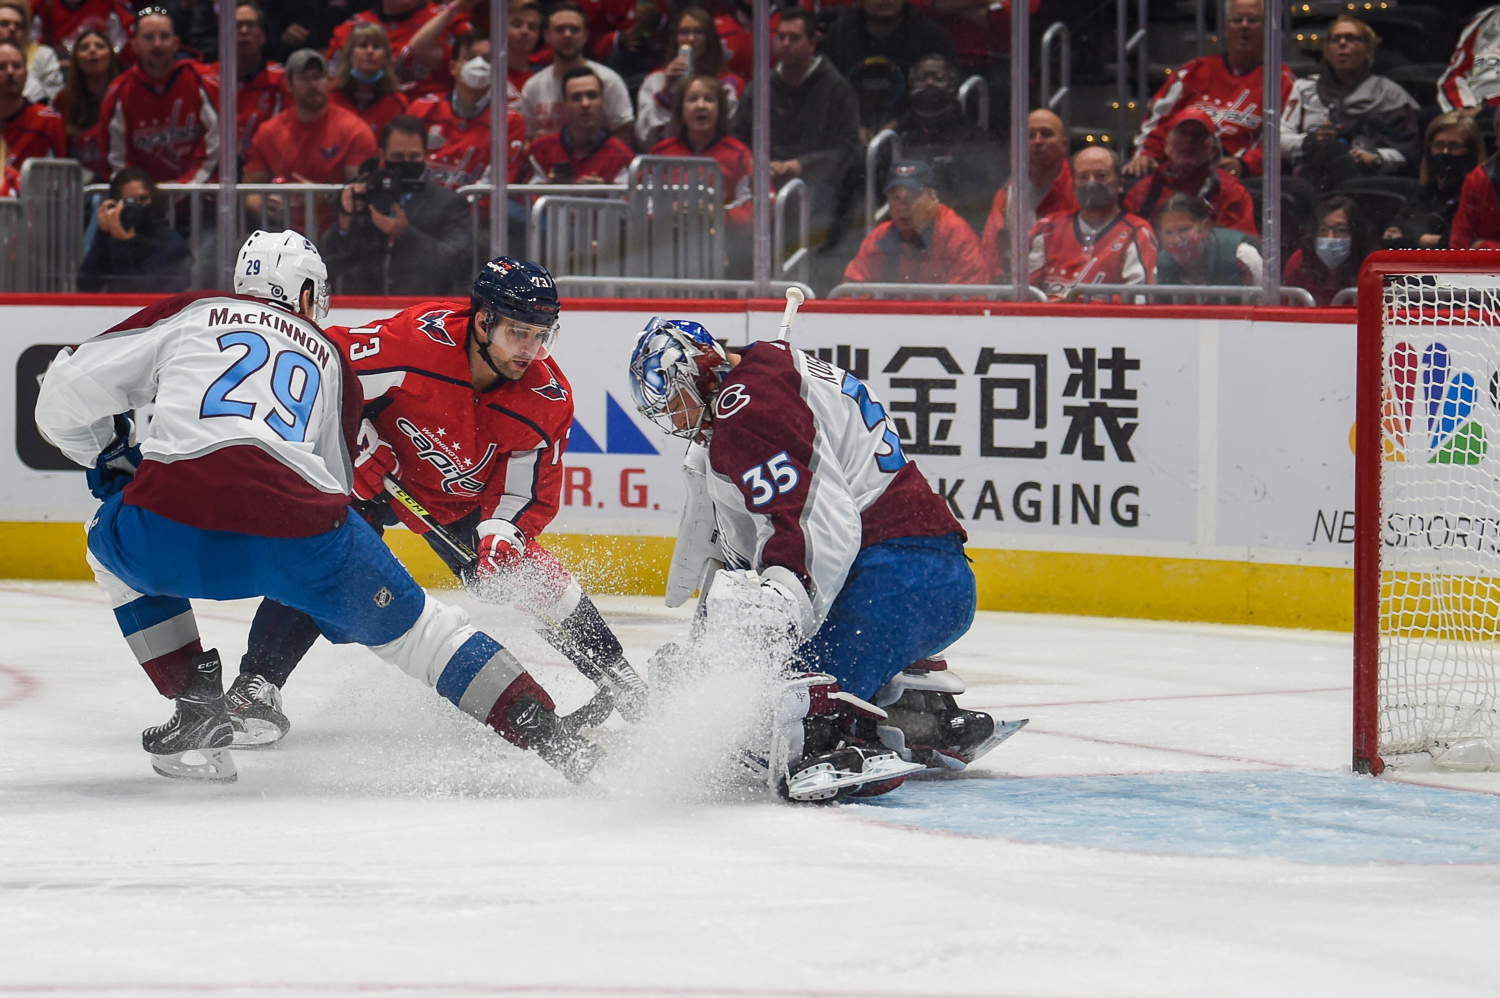
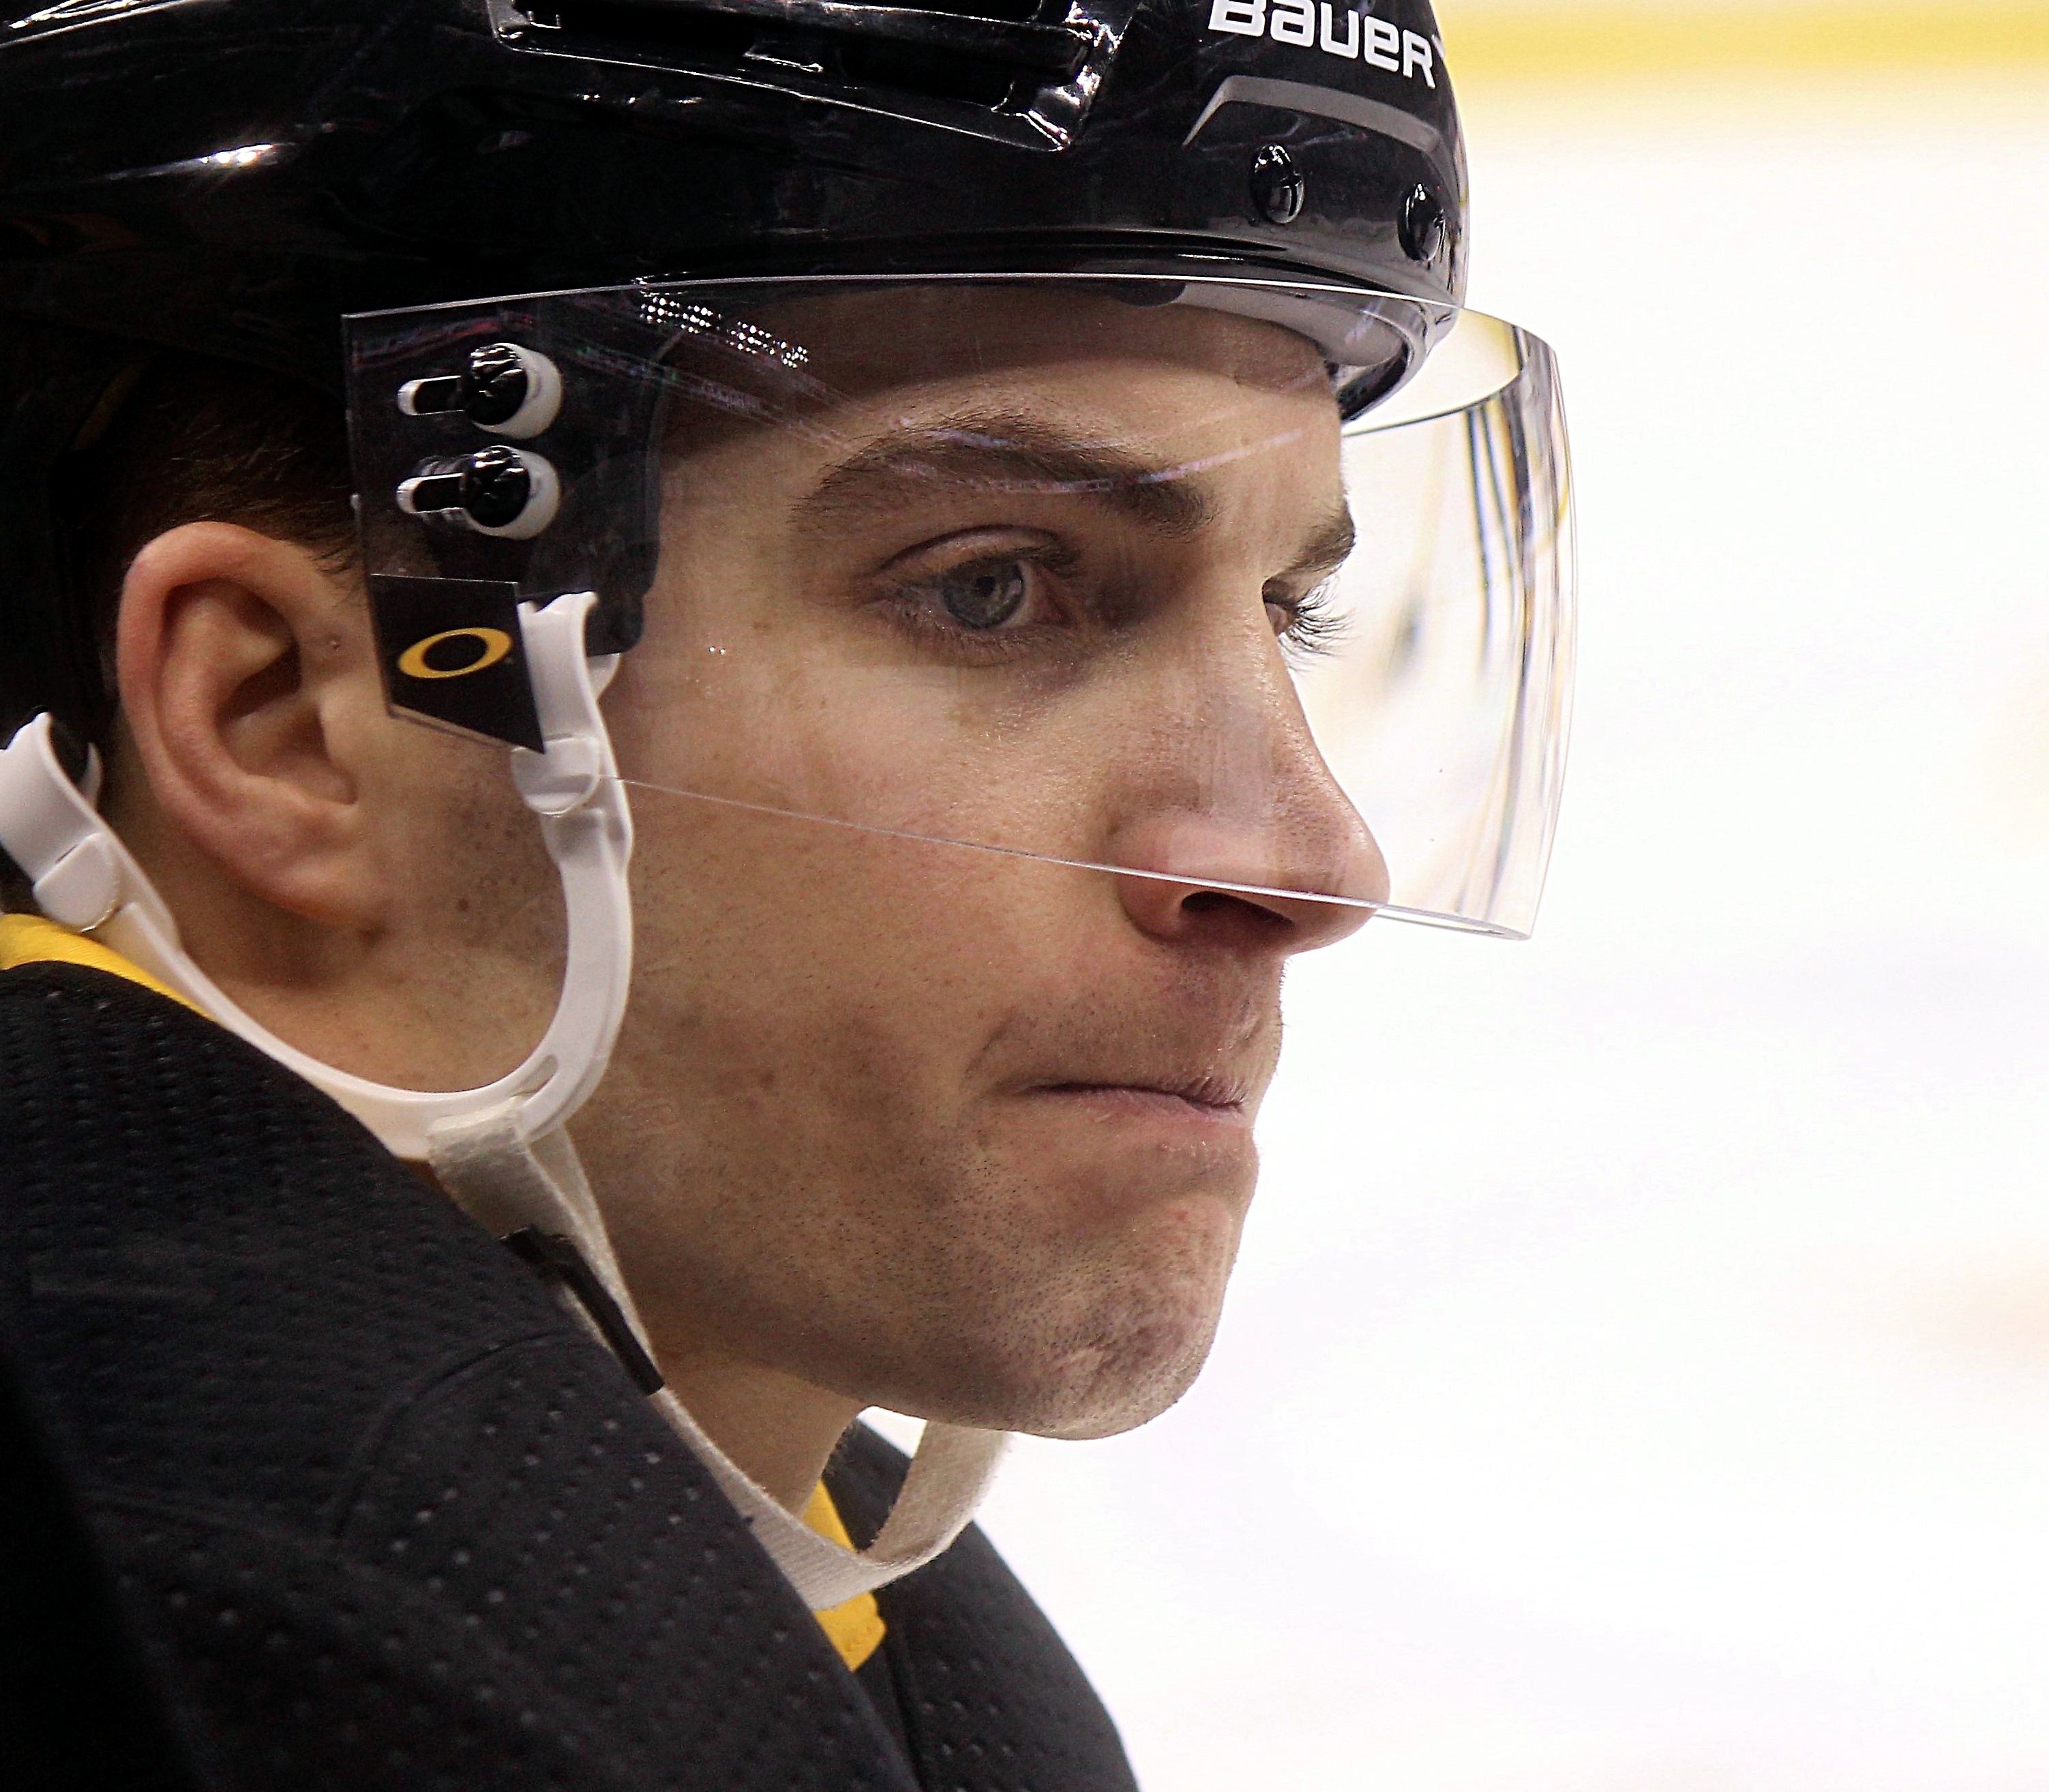
Facts drawn from Wikipédia, told in our own words.
Advanced stats
- TOI/GP
- 14:06
- PP TOI/GP
- 0:54
- SH TOI/GP
- 0:34
- Pts/GP
- 0.29
- EV points
- 15
- Hits
- 22
- Blocks
- 36
- Takeaways
- 18
- Corsi % (SAT)
- 49.4 %
- Off. zone starts
- 30.6 %
- Faceoffs
- 53.3 %
Stats and photos: NHL (NHL.com)
2026-27 projection
Projected points
10between 0 and 20 (80% range)
- Goals
- 3
- Assists
- 6
- Games
- 34
So far: 0 pts in 0 games. The team has played 17 of 84 games. Projected pace: 0.29 pts per game (last season: 0.29).
The projection follows last season's pace. Tested on 2,265 player seasons (2022-23 to 2025-26): average miss of 9 points over 82 games; for players at 0.9 points per game and up, it ran 5 points high on average.
Trend
Stable
- Points per game: 0.26 in 23-24, 0.29 in 25-26
- PAL Rating: 18 → 23
Outlook, age included
↘ Slight declineAge 34: the age when production usually declines
This is only a projection. It knows nothing about injuries, trades or role changes; one player in five finishes outside the range.
Player ratings, 2025-26
All ratings →Fourteen ratings from 0 to 100 drawn from data, never by hand: 75 = established NHL player, 95+ = elite.
OV · OverallConfidence 74 %
54
Replacement or prospect
- SK
- Skating
- 68
- Confidence 73 %
- ST
- Strength
- 63
- Confidence 78 %
- EN
- Endurance
- 68
- Confidence 75 %
- DU
- Durability
- 61
- Confidence 77 %
- CK
- Checking
- 63
- Confidence 78 %
- FG
- Fighting
- 70
- Confidence 56 %
- DI
- Discipline
- 76
- Confidence 78 %
- FO
- Faceoffs
- —
- PA
- Passing
- 68
- Confidence 74 %
- SC
- Scoring
- 58
- Confidence 74 %
- DF
- Defense
- 73
- Confidence 70 %
- PS
- Penalty shot
- 67
- Confidence 8 %
- EX
- Experience
- 88
- Confidence 100 %
Why these ratings?Hide details
SK — Skating68
- Top speed (35 %)35.8 · 71
- Bursts > 20 mph /60 (30 %)5.054 · 73
- Distance /60 (20 %)15.5 · 61
- Speed consistency (15 %)34.9 · 68
ST — Strength63
- Contact absorbed /60 (50 %)3.928 · 74
- Body mass (50 %)-1.368 · 60
EN — Endurance68
- Ice time per game (45 %)14 · 69
- Total ice time (20 %)867 · 69
- Shift length (15 %)44 · 66
- Lowest recent ice time per game (15 %)11.5 · 62
- Special-teams time per game (5 %)1.739 · 69
DU — Durability61
- Share of games played (100 %)0.7 · 61
CK — Checking63
- Hits /60 (70 %)2.796 · 65
- Lowest seasonal rate (20 %)2.284 · 66
- Season volume (10 %)3.136 · 61
FG — Fighting70
- Fights per 82 games (100 %)0.758 · 70
DI — Discipline76
- Net penalty value /60 (50 %)0.025 · 76
- Penalties taken /60 (30 %)0.587 · 78
- Penalties drawn /60 (20 %)0.736 · 73
PA — Passing68
- Primary assists /60 (40 %)0.544 · 65
- Secondary assists /60 (20 %)0.432 · 72
- Offensive creation (RAPM) (20 %)0.061 · 73
- Power-play points /60 (10 %)3.863 · 66
- Assist consistency (10 %)0.389 · 69
SC — Scoring58
- Goals /60 (25 %)0.655 · 59
- Individual xG /60 (20 %)0.719 · 62
- Finishing (goals − xG per shot) (20 %)-0.257 · 68
- High-danger chances /60 (15 %)1.092 · 63
- xG per shot (10 %)0.078 · 68
- Shot attempts /60 (10 %)12.4 · 66
DF — Defense73
- RAPM defense /60 (35 %)-0.028 · 70
- Relative xG against (20 %)-0.007 · 75
- On-ice xG against /60 (15 %)2.544 · 79
- Penalty kill /60 (10 %)-0.113 · 52
- Takeaways − giveaways /60 (10 %)-1.014 · 86
- Shot attempts against /60 (5 %)58.6 · 73
- Blocked shots /60 (5 %)2.878 · 82
PS — Penalty shot67
- Shootouts (60 %)32 · 65
- Penalty shots (40 %)26.7 · 76
EX — Experience88
- Career regular-season games (65 %)91
- Career playoff games (25 %)81
- NHL seasons (10 %)84
OV — Overall54
- SC · Scoring (28 %)58
- PA · Passing (22 %)68
- DF · Defense (18 %)73
- SK · Skating (12 %)68
- EN · Endurance (8 %)68
- DI · Discipline (5 %)76
- ST · Strength (4 %)63
- CK · Checking (3 %)63
| Season | OV | SK | SC | DF |
|---|---|---|---|---|
| 2025-26 | 54 | 68 | 58 | 73 |
| 2023-24 | 64 | 76 | 62 | 69 |
| 2022-23 | 65 | 75 | 67 | 61 |
The bars show confidence (sample size), not player quality. — : not enough data, not a zero. Engine version 1.0.
WAR and PAL ratings, 2025-26
How we rate →PAL Rating scores performance from 0 to 100 against players at the same position (50 = average player), starting from the player's strength, offensive or defensive. Value Rating compares that performance with what the player costs: 50 means paid what the play is worth.
WAR
0.1
wins above replacement
319 of 615
PAL Rating
23/ 100
Performance · Below average
353 of 476 at the position
Value Rating
40/ 100
Poor return
0.78 M$ · expected PAL 32
ProfileBalancedNeither end dominates
- Offense
- 17
- Defense
- 43
See full detailsHide details
- Offense
- 13
- Creation
- 33
- Shooting
- 15
- Possession
- 41
- Defense
- 55
- Discipline
- 69
- Power play
- 11
- Penalty kill
- 10
From 0 to 100; 50 is the average player at the same position, adjusted for ice time.
| Season | Team | WAR | PAL | Value | Cap hit |
|---|---|---|---|---|---|
| 2025-26 | NYR | 0.1 | 23 | 40 | 0.78 M$ |
| 2023-24 | TBL | -0.1 | 18 | 16 | 2.00 M$ |
| 2022-23 | WSH | 0.1 | 16 | 18 | 1.50 M$ |
Hockey IQ, 2025-26
Rankings and method →The quality of the player's decisions with and against the puck at 5-on-5, against regulars at the same position (50 = average). PAL measures output; IQ measures how the player plays.
Overall IQ
49/ 100
Average
better than 49% of forwards, offense and defense combined
Offensive IQ
12/ 100
Low
passing, shots, puck
Defensive IQ
86/ 100
Very good
takeaways, discipline, own zone
Overall IQ isn't an average of the two scores: it's the player's rank with offense and defense combined, 215 of 424 forwards.
See full detailsHide details
Offense
- Playmaking passes
- 17
- Shot selection
- 15
- Penalties drawn
- 61
- Puck management
- 26
Defense
- Takeaways
- 81
- Discipline
- 71
- Safe zone exits
- 55
Percentiles: 80 means better than 80% of regulars at the same position. Play without the puck (positioning, coverage) isn't measured: the NHL doesn't publish that data.
| Season | Team | IQ | Off. | Def. |
|---|---|---|---|---|
| 2025-26 | NYR | 49 | 12 | 86 |
| 2023-24 | TBL | 68 | 40 | 80 |
| 2022-23 | WSH | 60 | 39 | 73 |
WAR, 2025-26
How it's calculated →Wins added to the team, compared with a replacement-level player called up from the AHL.
0.1
wins above replacement
-0.7 to 1.2 — 90% interval
319 of 615 forwards
+0.7 goals above replacement
Full leaderboard →See full detailsHide details
- EV offense
- +0.4
- EV defense
- -0.2
- Power play
- -0.1
- Penalty kill
- -0.3
- Shooting
- -2.1
- Penalties
- +0.7
- Average → replacement
- +2.3
In goals.
| Season | Team | GP | WAR | 90% interval | Rank |
|---|---|---|---|---|---|
| 2025-26 | NYR | 62 | 0.1 | -0.7 to 1.2 | 319/615 |
| 2024-25 | TBL | 5 | -0.1 | -0.3 to 0.0 | 455/596 |
| 2023-24 | TBL | 57 | -0.1 | -0.7 to 0.4 | 481/608 |
| 2022-23 | WSH | 82 | 0.1 | -0.7 to 1.4 | 292/617 |
Player tracking (NHL EDGE)
League EDGE leaderboards →Speed, shot power, distance covered, time by zone: measured by chips in the puck and shoulder pads. 90th percentile = better than 90% of players.
- Hardest shot
- 128.7 km/h20th percentileleague avg. 134.6 km/h
- Top skating speed
- 36.2 km/h63rd percentileleague avg. 35.7 km/h
- Bursts over 20 mph, season
- 5145th percentileleague avg. 75
- Offensive zone time
- 43.8 %72nd percentileleague avg. 43.1 %
See full detailsHide details
- Total distance, season
- 220.1 km52nd percentileleague avg. 198.8 km
- Distance, single-game high
- 4.87 km55th percentileleague avg. 4.70 km
- Offensive zone at 5v5
- 43.7 %92nd percentileleague avg. 42.0 %
- Neutral zone time
- 17.2 %13th percentileleague avg. 16.8 %
- Defensive zone time
- 38.9 %65th percentileleague avg. 40.1 %
Shooting
| Shots on goal | Goals | Shooting % | |
|---|---|---|---|
| All | 8154th percentile | 745th percentile | 8.6 %9th percentile |
| High danger | 2648th percentile | 549th percentile | 19.2 %45th percentile |
| Mid range | 3366th percentile | 244th percentile | 6.1 %11th percentile |
| Long range | 755th percentile | 00th percentile | 0.0 %0th percentile |
Shots on goal by zone
2025-2026 regular season. Measured by puck and player tracking chips; the percentile ranks the player within the league.
Game log, 2025-26
 TBL
 FLA
 DAL
 WSH
 DET
 MTL
 NJD
 CHI
 TOR
 OTT
 WPG
 CBJ
 LAK
 MIN
 CGY
 PHI
 PIT
 CAR
 NSH
 STL
 VAN
 ANA
 VGK
 COL
 UTA
 NYI
 SEA
 EDM
 SJS
Conor Sheary: frequently asked questions
How many goals does Conor Sheary have in 2025-26?
Conor Sheary has 7 goals and 18 points (11 assists) in 62 games in 2025-26.
How old is Conor Sheary?
Conor Sheary is 34 years old: he was born on June 8, 1992.
How tall is Conor Sheary, and how much does he weigh?
Conor Sheary is 5'8" (173 cm) and weighs 183 lb (83 kg).
Where is Conor Sheary from?
United States: Conor Sheary was born in Winchester, Massachusetts, United States.
What team does Conor Sheary play for?
Conor Sheary plays for the Buffalo Sabres in the NHL, at L, wearing number 43.
Is Conor Sheary injured?
No: Conor Sheary is not on the latest NHL injury report. This answer is updated throughout the season.
How good is Conor Sheary?
Conor Sheary produced 0.1 wins above replacement (WAR) in 2025-26, 319th of 615 players at his position in the NHL. His PAL rating is 23 out of 100: below average for his position.
How much does Conor Sheary make?
Conor Sheary earns $775K for the 2025-26 season. His Value Rating is 40 out of 100 (poor return): it measures the on-field return for that salary, compared with players at his position.
When does Conor Sheary's contract end?
Conor Sheary's contract runs through the 2026-27 season; he will then be an unrestricted free agent.
Is Conor Sheary overpaid?
Yes, his output falls short of what his salary should buy. His Value rating is 40 out of 100 (poor return), where 50 is the output expected for his salary, compared with players at his position.
Is Conor Sheary a top-10 player at his position?
No: by WAR, he ranks 319th of 615 players at his position in the NHL in 2025-26. Our comparison tool puts him side by side with any other player.
Is Conor Sheary getting better?
Yes: his PAL rating went from 18 in 2023-24 to 23 in 2025-26 (out of 100, 50 = average player at his position).
How has Conor Sheary played lately?
Over his last 10 games, Conor Sheary has 5 points (3 goals, 2 assists).
What are Conor Sheary's career stats?
Over his NHL career, Conor Sheary has 655 games, 131 goals, 154 assists and 285 points. His best season: 2016-17, with 53 points in 61 games.
Is Conor Sheary better at home or on the road?
At home: in 2025-26, he averages 0.36 points per game at home (12 in 33 games) and 0.21 on the road (6 in 29 games).
How does Conor Sheary perform in the playoffs?
In the playoffs, Conor Sheary has 72 games and 23 points in his career. His pace (0.32 points per game) is lower than his regular-season pace (0.44).
Which player is most similar to Conor Sheary?
Lenni Hameenaho: he is the player at his position whose PAL profile (the 0-to-100 dimensions) is closest to his in 2025-26.
Lenni Hameenaho's page →Is Conor Sheary a good fantasy pick?
Probably not, except in deep leagues: our projection has him at 10 points in 2026-27, or 0.29 points per game.
Is Conor Sheary married?
Yes, married to Jordan Sullivan in August 2018.
What is Conor Sheary's nationality?
Conor Sheary is American.
How many championships has Conor Sheary won?
2: Stanley Cup 2016 with the Pittsburgh Penguins; Stanley Cup 2017 with the Pittsburgh Penguins.
Where did Conor Sheary play before turning pro?
University of Massachusetts Amherst (Minutemen) — through his senior season 2013–14.
How many points is Conor Sheary projected to score in 2026-27?
Our projection has him at 10 points in 34 games in 2026-27 (0 to 20 points, 80% interval), based on his recent seasons, age and role.
See also: his Buffalo Sabres teammates
Full roster →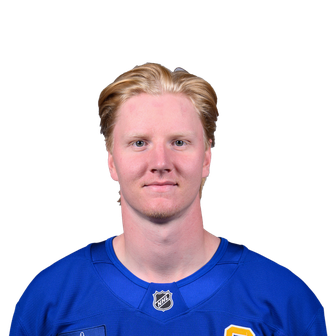


NHL.com ↗ · Stats and photos: NHL (NHL.com)